<?xml version="1.0" encoding="utf-8"?><feed xmlns="http://www.w3.org/2005/Atom" ><generator uri="https://jekyllrb.com/" version="3.10.0">Jekyll</generator><link href="https://cadelgadof.github.io/feed.xml" rel="self" type="application/atom+xml" /><link href="https://cadelgadof.github.io/" rel="alternate" type="text/html" /><updated>2026-08-21T16:46:42+00:00</updated><id>https://cadelgadof.github.io/feed.xml</id><title type="html">Carlos Delgado</title><subtitle>Personal academic website of Carlos Delgado</subtitle><author><name>Carlos Delgado</name><email>cadelgado@tamu.edu</email></author><entry><title type="html">Why 5% Isn’t Always 5%: The Fisher Equation and Money Illusion</title><link href="https://cadelgadof.github.io/posts/2026/08/fisher-equation-money-illusion/" rel="alternate" type="text/html" title="Why 5% Isn’t Always 5%: The Fisher Equation and Money Illusion" /><published>2026-08-04T00:00:00+00:00</published><updated>2026-08-04T00:00:00+00:00</updated><id>https://cadelgadof.github.io/posts/2026/08/fisher-equation-money-illusion</id><content type="html" xml:base="https://cadelgadof.github.io/posts/2026/08/fisher-equation-money-illusion/"><![CDATA[<!--more-->

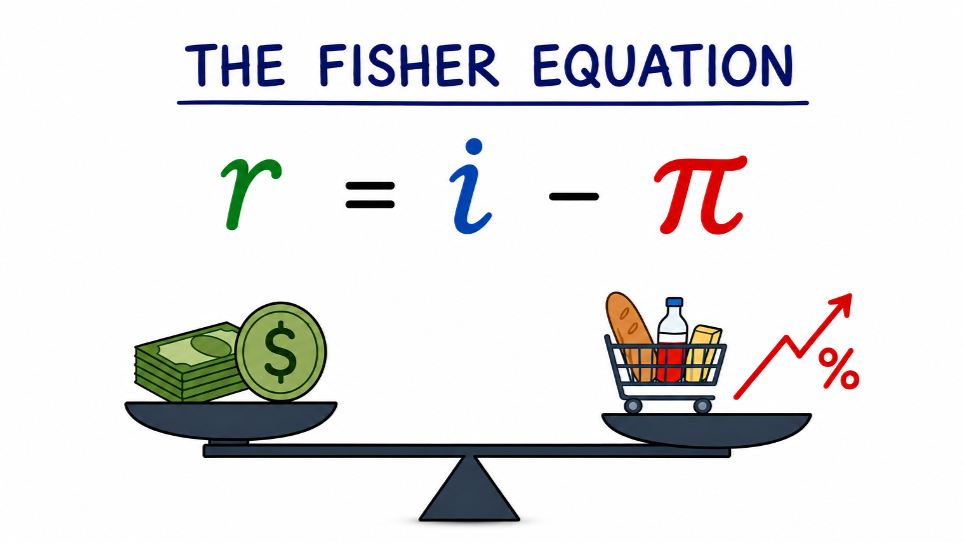
<p>Imagine you have $1,000 available to save. You decide to deposit the money in a savings account that pays 5% annual interest. In nominal terms, you will have $1,050 at the end of one year. However, to determine the true value of your investment in terms of purchasing power, you must take inflation into account. Suppose inflation is 2% over the course of the year. In that case, the real value of your investment after one year is approximately $1,030. This idea gives rise to the concept of the real interest rate, which is approximately equal to the nominal interest rate minus the inflation rate (Fisher equation). In this example, the real interest rate is 3%.</p>

<p><img src="/images/fisher-equation.png" alt="The Fisher Equation" /></p>

<p>In macroeconomic models, consumers adjust their consumption in response to changes in the real interest rate. This is known as the intertemporal substitution channel, in which higher real interest rates create an incentive to save more today and postpone consumption to the future. Consistent with this mechanism, survey data show that households report reducing their spending, particularly on durable goods, when interest rates increase (<a href="https://www.nber.org/papers/w35127">Grigoli et al. (2026)</a>). However, economists have asked whether households actually understand and make decisions based on real interest rates. Do they take purchasing power into account when evaluating the returns to saving, or do they focus only on nominal interest rates? Recent research provides evidence on this question.</p>

<p>The study by <a href="https://papers.boschrosa.com/consumption.pdf">Bosch-Rosa et al. (2026)</a> uses a within-subject survey experiment conducted on a representative sample of the German population. Participants were presented with hypothetical scenarios in which the real interest rate increased by 5 percentage points, either through an increase in the nominal interest rate or through an equivalent decline in inflation. Respondents were then asked how they would adjust their consumption in each scenario. If households fully understand the concept of the real interest rate, their consumption responses should be the same in both cases. Surprisingly (or perhaps not), respondents reported larger reductions in consumption, higher saving, and lower borrowing when nominal interest rates increased, while adjusting these margins much less when inflation declined. One mechanism that partially explains this asymmetry is the difference in perceived wealth effects across the two scenarios. In a nutshell, households appear to internalize the consequences of changes in nominal interest rates more readily than those of disinflation.</p>

<p>Other studies have examined whether households misperceive the erosion of the purchasing power of money over time. This phenomenon is known as money illusion, in which consumers think primarily in nominal rather than real terms. Results from a survey experiment conducted in Japan show that people base their decisions on nominal interest rates rather than real interest rates, consistent with the findings of the previous study (<a href="http://www.accessecon.com/Pubs/EB/2025/Volume45/EB-25-V45-I1-P11.pdf">Niizeki, 2025</a>). Moreover, <a href="http://www.accessecon.com/Pubs/EB/2025/Volume45/EB-25-V45-I1-P11.pdf">Niizeki (2025)</a> investigates education as a potential mechanism but finds no significant differences in the degree of money illusion between more and less educated individuals. In contrast, <a href="https://doi.org/10.1016/j.joep.2019.102211">Darriet et al. (2020)</a> examine the roles of financial knowledge and numeracy. They find that individuals with greater financial knowledge are less susceptible to money illusion, whereas numeracy has no significant effect.</p>

<p>From a different perspective, <a href="https://proceedings.emac-online.org/pdfs/A2024-118995.pdf">Majumder et al. (2024)</a> examine not only the extent to which people are affected by money illusion, but also the extent to which they believe others are affected by it. In the presence of inflation, they find that individuals believe they are less likely to buy and equally likely to sell than others when facing a higher nominal price with no change in the real price. Moreover, when asked directly, participants report placing greater importance on the real value of money than on its nominal value, relative to others. This suggests that people tend to perceive themselves as being less susceptible to money illusion than others.</p>

<p>Focusing on investors’ behavior, <a href="https://doi.org/10.1111/jmcb.12923">Lioui and Tarelli (2023)</a> investigate why the market demand for Treasury Inflation-Protected Securities (TIPS) remains relatively low, considering money illusion as a potential explanation. They estimate that investors incur a certainty-equivalent loss of 1.6% per year by not investing in inflation-indexed bonds. However, investors who suffer from money illusion perceive this loss to be much smaller, only 0.5% per year.</p>

<p>The presence of money illusion may depend on which component of the household balance sheet is affected (assets or debt). In this context, <a href="https://www.nber.org/papers/w31672">Schnorpfeil et al. (2023)</a> find that, although households are generally well informed about prevailing inflation and are concerned about its impact on their wealth, and many understand that inflation erodes the real value of nominal assets, most are unaware that inflation also erodes the real value of nominal debt. When households receive information about the debt-erosion channel, they revise upward their beliefs about the value of nominal debt and, consequently, about their own real net wealth. These belief revisions causally affect both actual consumption and hypothetical borrowing decisions. In a nutshell, real wealth mediates the effect of inflation on consumption once households become aware of the wealth effects of inflation.</p>

<p>I have the perception that the presence (or at least the intensity) of money illusion is state dependent. In particular, households may become more aware of the erosion of the nominal value of money during periods of high inflation. For example, <a href="https://www.oliverpfaeuti.com/website/IAT.pdf">Pfäuti (2026)</a> finds evidence of an inflation attention threshold of approximately 4% in the United States, at which households experience a discrete increase in their attention to inflation. <a href="https://doi.org/10.1162/rest_a_01402">Korenok et al. (2026)</a> confirm this finding by estimating similar attention thresholds for most countries, typically between 2% and 4% inflation.</p>

<p>When considering cross-sectional differences in money illusion, a promising avenue for research is to examine its relationship with attention to inflation. For instance, individuals who have experienced episodes of high inflation in the past (<a href="https://www.nber.org/papers/w32160">Braggion et al., 2024</a>) may be less susceptible to money illusion. Similarly, UK households with greater exposure to financial assets and liabilities pay more attention to inflation (<a href="https://drive.google.com/file/d/1dekITETvZTAM-GRy4a8N3rUNXUJCw3tR/view?usp=sharing">Delgado, 2026</a>), suggesting that they may be less prone to money illusion.</p>

<h2 id="references">References</h2>

<div class="blog-references">

<p>
Bosch-Rosa, C., Heinemann, F., Massenot, B., &amp; Meissner, T. (2026).
<a href="https://papers.boschrosa.com/consumption.pdf" target="_blank" rel="noopener noreferrer">
<em>Different Consumption Responses to Equivalent Changes in the Real Interest Rate.</em>
</a>
</p>

<p>
Braggion, F., von Meyerinck, F., Schaub, N., &amp; Weber, M. (2024).
<a href="https://www.nber.org/papers/w32160" target="_blank" rel="noopener noreferrer">
<em>The long-term effects of inflation on inflation expectations.</em>
</a>
NBER Working Paper No. 32160. National Bureau of Economic Research.
</p>

<p>
Darriet, E., Guille, M., Vergnaud, J. C., &amp; Shimizu, M. (2020).
<a href="https://doi.org/10.1016/j.joep.2019.102211" target="_blank" rel="noopener noreferrer">
Money illusion, financial literacy and numeracy: Experimental evidence.
</a>
<em>Journal of Economic Psychology, 76</em>, 102211.
</p>

<p>
Delgado, C. (2026).
<a href="https://drive.google.com/file/d/1dekITETvZTAM-GRy4a8N3rUNXUJCw3tR/view?usp=sharing" target="_blank" rel="noopener noreferrer">
<em>Household (in)attention to inflation and balance-sheet position: Macroeconomic implications.</em>
</a>
Working paper, Texas A&amp;M University.
</p>

<p>
Grigoli, F., Sandri, D., Gorodnichenko, Y., &amp; Coibion, O. (2026).
<a href="https://www.nber.org/papers/w35127" target="_blank" rel="noopener noreferrer">
<em>Monetary policy according to households: perceptions, reactions and channels.</em>
</a>
NBER Working Paper No. 35127.
</p>

<p>
Korenok, O., Munro, D., &amp; Chen, J. (2026).
<a href="https://doi.org/10.1162/rest_a_01402" target="_blank" rel="noopener noreferrer">
Inflation and attention thresholds.
</a>
<em>Review of Economics and Statistics</em>, 1–9.
</p>

<p>
Lioui, A., &amp; Tarelli, A. (2023).
<a href="https://doi.org/10.1111/jmcb.12923" target="_blank" rel="noopener noreferrer">
Money illusion and TIPS demand.
</a>
<em>Journal of Money, Credit and Banking, 55</em>(1), 171–214.
</p>

<p>
Majumder, R., Ziano, I., &amp; Mai, R. (2024).
<a href="https://proceedings.emac-online.org/pdfs/A2024-118995.pdf" target="_blank" rel="noopener noreferrer">
Money illusion for others.
</a>
<em>Proceedings of the European Marketing Academy, 52</em>, 118995.
</p>

<p>
Niizeki, T. (2025).
<a href="http://www.accessecon.com/Pubs/EB/2025/Volume45/EB-25-V45-I1-P11.pdf" target="_blank" rel="noopener noreferrer">
Money illusion of interest rates and household decision-making.
</a>
<em>Economics Bulletin, 45</em>(1), 111–117.
</p>

<p>
Pfäuti, O. (2026).
<a href="https://www.oliverpfaeuti.com/website/IAT.pdf" target="_blank" rel="noopener noreferrer">
<em>The inflation attention threshold and inflation surges.</em>
</a>
Working paper, The University of Texas at Austin.
</p>

<p>
Schnorpfeil, P., Weber, M., &amp; Hackethal, A. (2023).
<a href="https://www.nber.org/papers/w31672" target="_blank" rel="noopener noreferrer">
<em>Households' response to the wealth effects of inflation.</em>
</a>
NBER Working Paper No. 31672.
</p>

</div>]]></content><author><name>Carlos Delgado</name><email>cadelgado@tamu.edu</email></author><category term="macroeconomics" /><category term="household finance" /><category term="monetary economics" /><category term="behavioral macroeconomics" /><category term="inflation" /><summary type="html"><![CDATA[]]></summary></entry><entry><title type="html">How Do Households Perceive the Evolution of Interest Rates? Some Facts</title><link href="https://cadelgadof.github.io/posts/2026/05/households-interest-rates/" rel="alternate" type="text/html" title="How Do Households Perceive the Evolution of Interest Rates? Some Facts" /><published>2026-05-04T00:00:00+00:00</published><updated>2026-05-04T00:00:00+00:00</updated><id>https://cadelgadof.github.io/posts/2026/05/households-interest-rates</id><content type="html" xml:base="https://cadelgadof.github.io/posts/2026/05/households-interest-rates/"><![CDATA[<!--more-->

<p>The analysis of how consumers perceive and forecast macroeconomic variables is key to better understanding how they make decisions about spending, saving, and borrowing. Existing surveys that elicit household expectations of aggregate variables mainly focus on inflation and unemployment, although the latter is somewhat limited. However, research on how households perceive movements in interest rates remains relatively scarce compared to the extensive work on expectations for other macroeconomic variables.</p>

<p>One reason inflation has been the most common variable used to analyze household expectations is that it is publicly available. Although consumers face different bundles of goods and are exposed to different prices, there is an official measure of inflation. This is not the case for interest rates. While monetary authorities set a nominal policy rate, it serves mainly as a benchmark that guides the evolution of other interest rates in the market.</p>

<p>If we ask households about the expected evolution of interest rates, they are unlikely to think solely about the policy rate; instead, they consider the range of rates they actually face. In addition, there is substantial heterogeneity in households’ financial positions. In this sense, we can distinguish between saving rates and borrowing rates, with the latter being higher on average. At the same time, there are differences depending on the financial product involved. For example, borrowing rates differ between consumer credit and mortgages, with the latter typically associated with collateral. This clearly leads to differences in the magnitudes of interest rates. Additionally, factors such as credit conditions, the type of lending institution, and market power contribute to dispersion in interest rates.</p>

<p>Although institutions construct aggregate measures of interest rates by category, there is no single official variable that represents “the” market interest rate, as there is for inflation. By contrast, institutions define a standard basket of goods and compute a weighted average of prices. However, this is not the case for interest rates, because households differ in their balance sheet positions. Some are more exposed to financial assets, others are more exposed to debt, and some have little or no exposure to these markets.</p>

<p>In this blog, I present some stylized facts about how individuals perceive the evolution of interest rates, including those related to monetary policy. In particular, I focus on cross-sectional differences.</p>

<p>I use data from the Inflation Attitudes Survey (IAS) conducted by the Bank of England, which elicits these perceptions.</p>

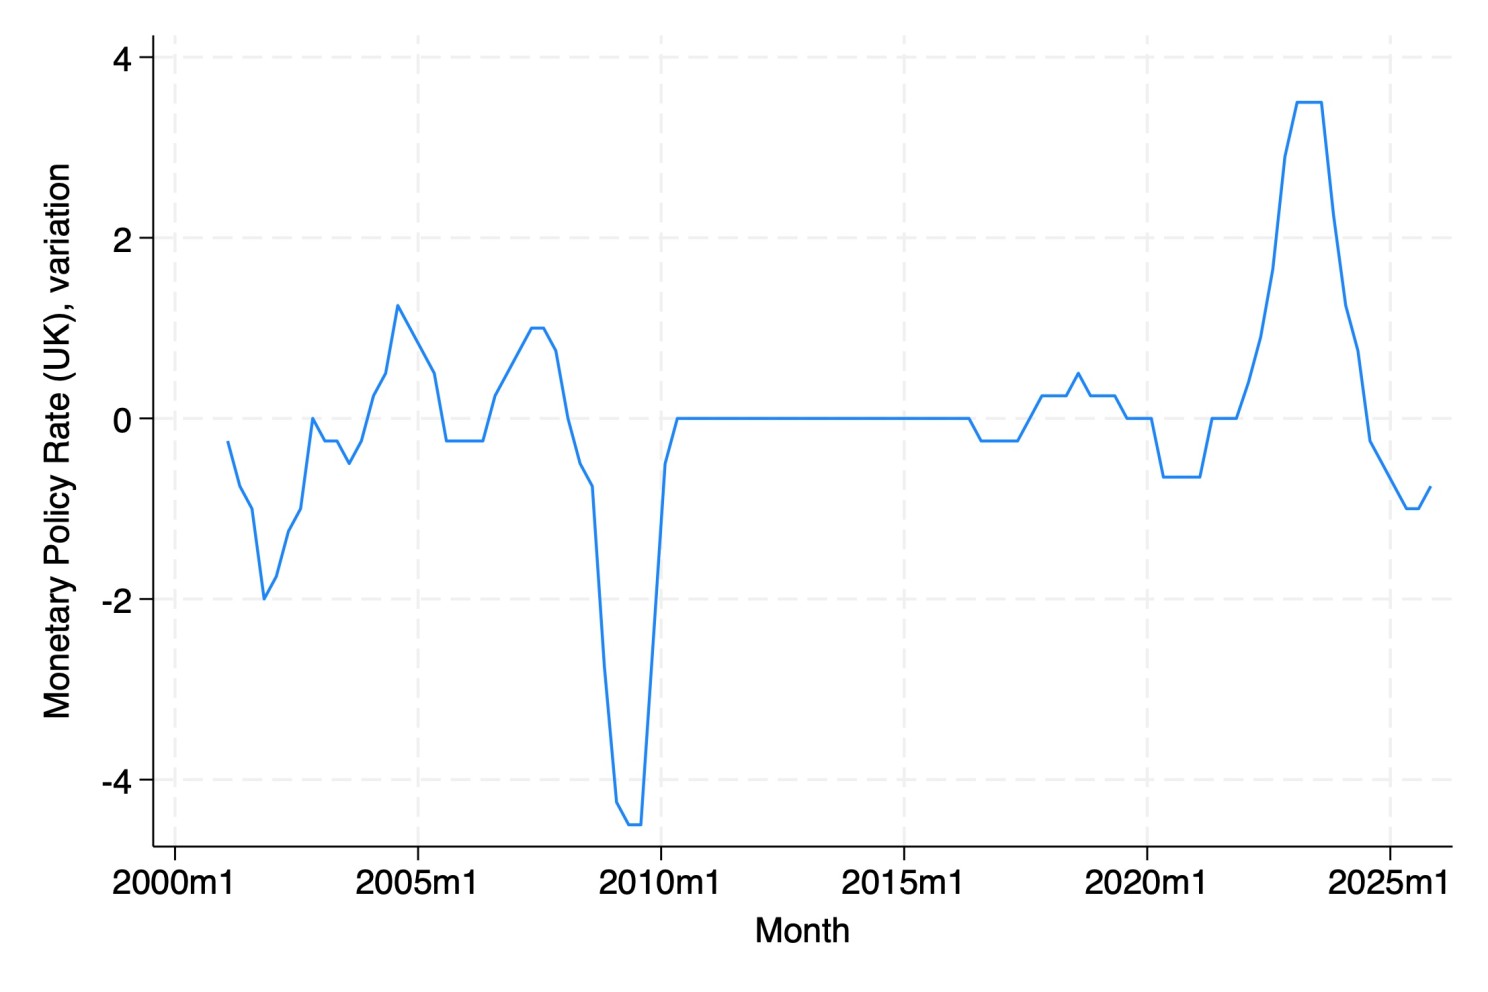
<p>Figure 1 presents the year-over-year change in the monetary policy rate in the UK. Three periods are worth highlighting. First, during the years around the Great Recession (2008–2010), there was a sharp expansionary monetary policy, with reductions in the nominal interest rate of more than 4 percentage points. Second, from 2010 to 2017, there was little variation in the policy rate, as the Bank of England had reached the zero lower bound. In this context, central banks implemented unconventional monetary policies such as forward guidance and quantitative easing. Finally, during and after 2020, the policy rate increased to combat the surge in inflation associated with the COVID-19 pandemic, as well as rising commodity prices.</p>

<figure class="blog-figure">
  <img src="/images/blog/interest-rates-policy-uk.jpg" alt="Year-over-year variation in the UK monetary policy rate" />
  <figcaption>Figure 1. Year-over-year variation in the UK monetary policy rate.</figcaption>
</figure>

<figure class="blog-figure">
  <img src="/images/blog/interest-rates-financial-institutions.jpg" alt="Variation in interest rates of UK resident monetary financial institutions" />
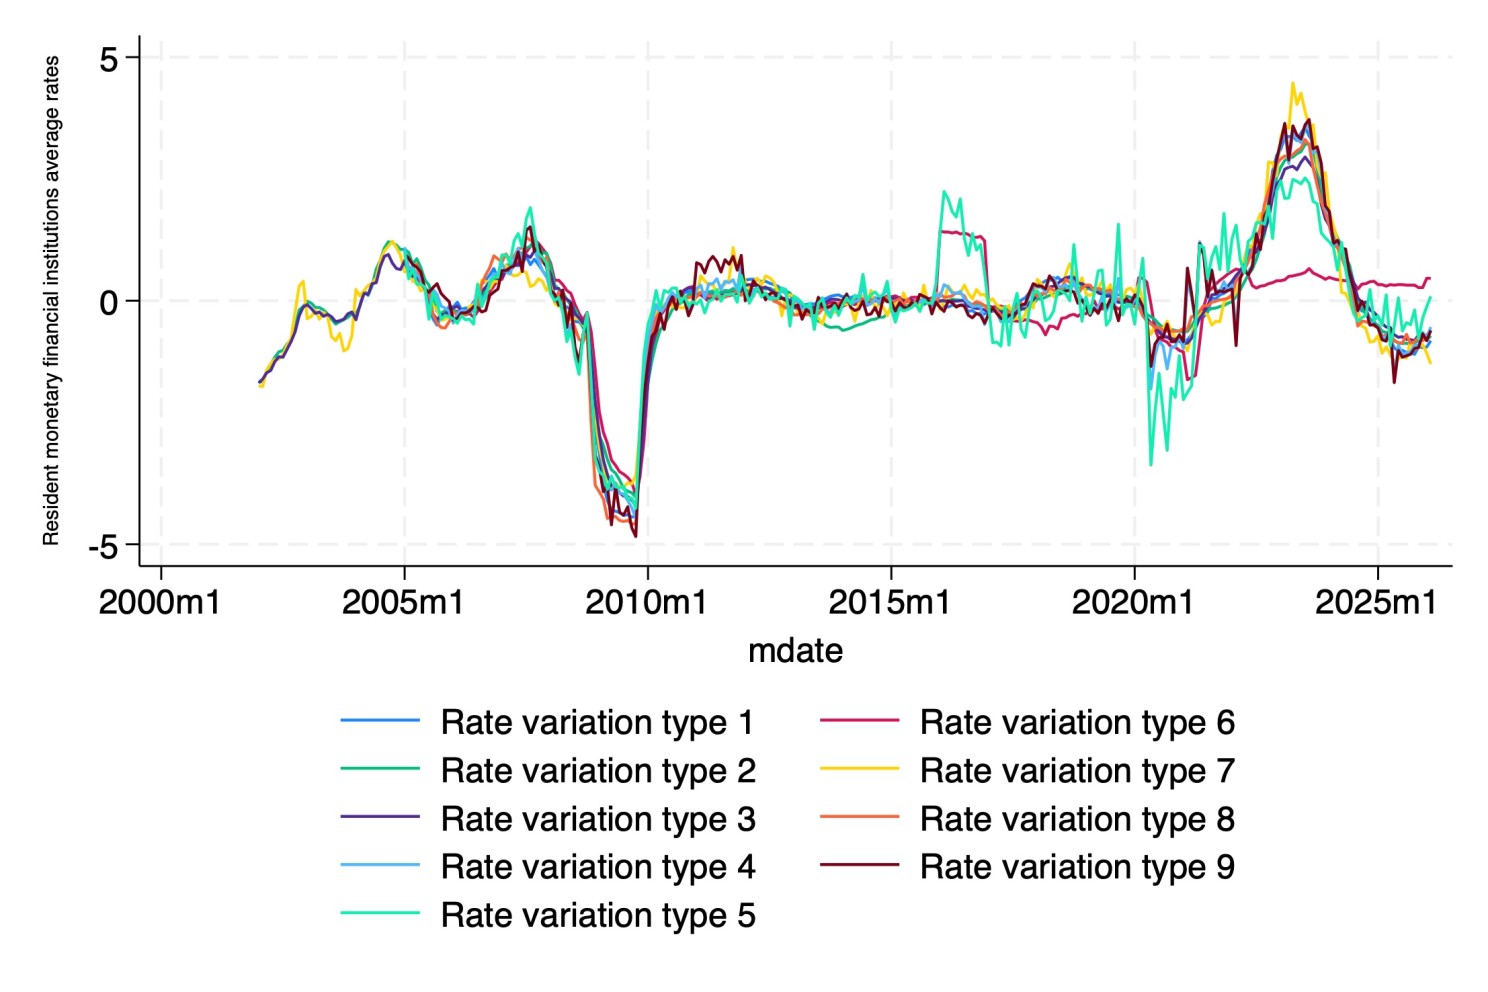
  <figcaption>Figure 2. Year-over-year variation in interest rates across different categories.</figcaption>
</figure>

<p>Figure 2 presents the yearly variation in lending interest rates across different categories. I consider the year-over-year variation in the monthly average of sterling-weighted interest rates for UK-resident monetary financial institutions (excluding the central bank) on private non-financial corporations. These rates differ depending on whether they are fixed or floating, as well as on the nature of the transaction (e.g., loans, time deposits, overdrafts, etc.). On average, their evolution follows a similar pattern to the official policy rate.</p>

<p>How do households perceive changes in interest rates across demographic groups? The IAS includes the following question: <em>“How would you say interest rates on things such as mortgages, bank loans, and savings have changed over the last twelve months? Have they…? [Risen a lot, risen a little, stayed about the same, fallen a little, fallen a lot]”</em></p>

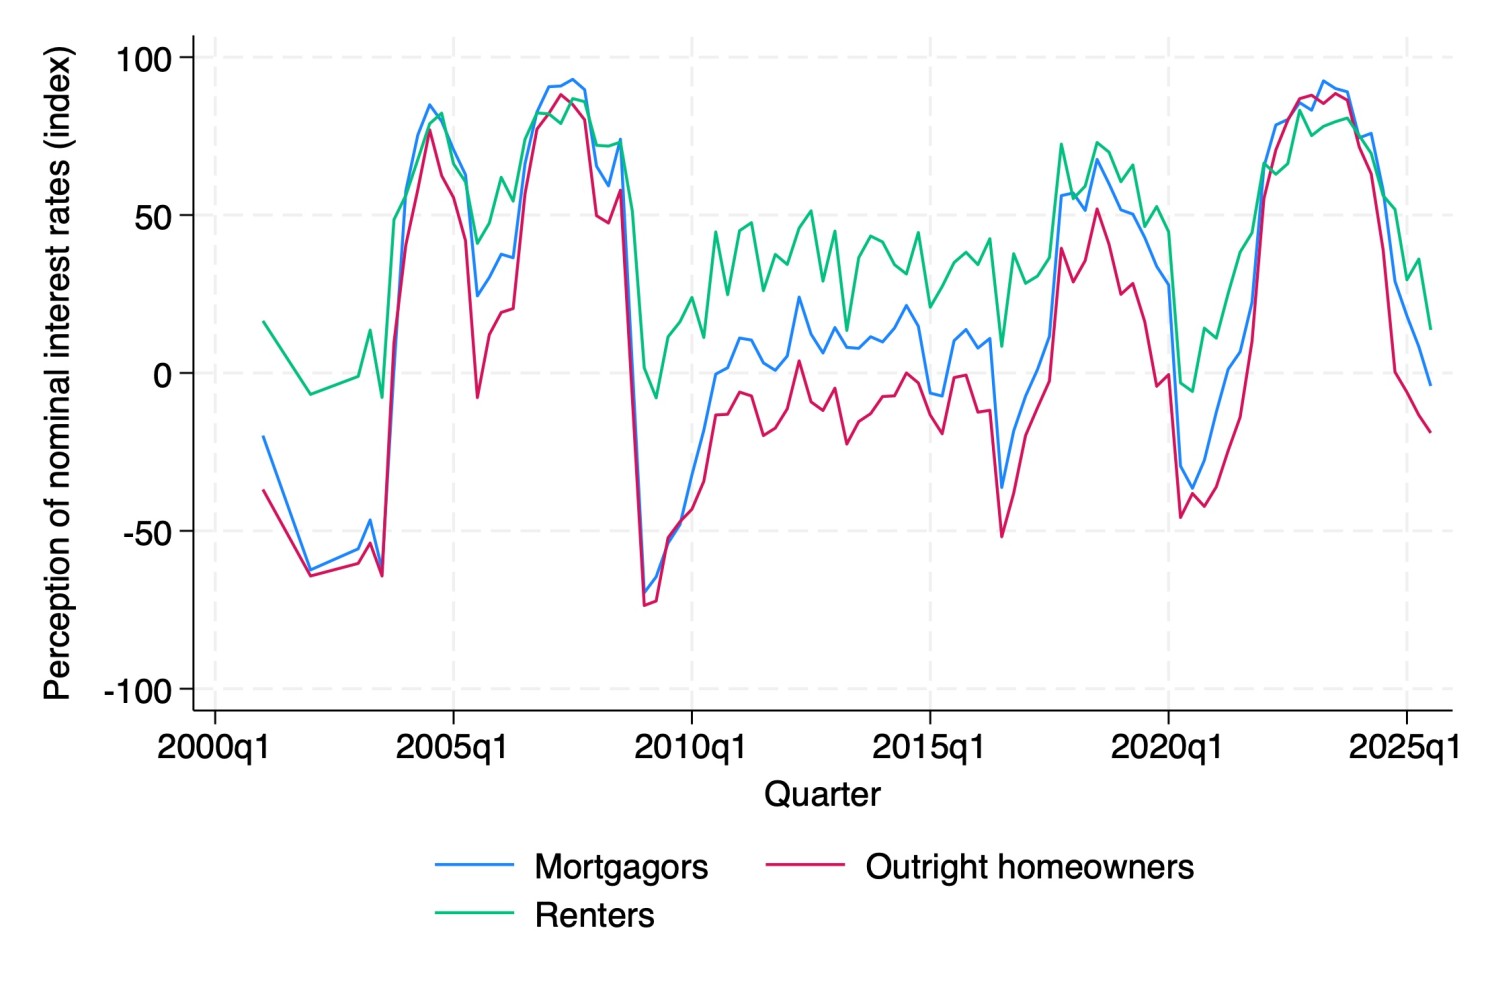
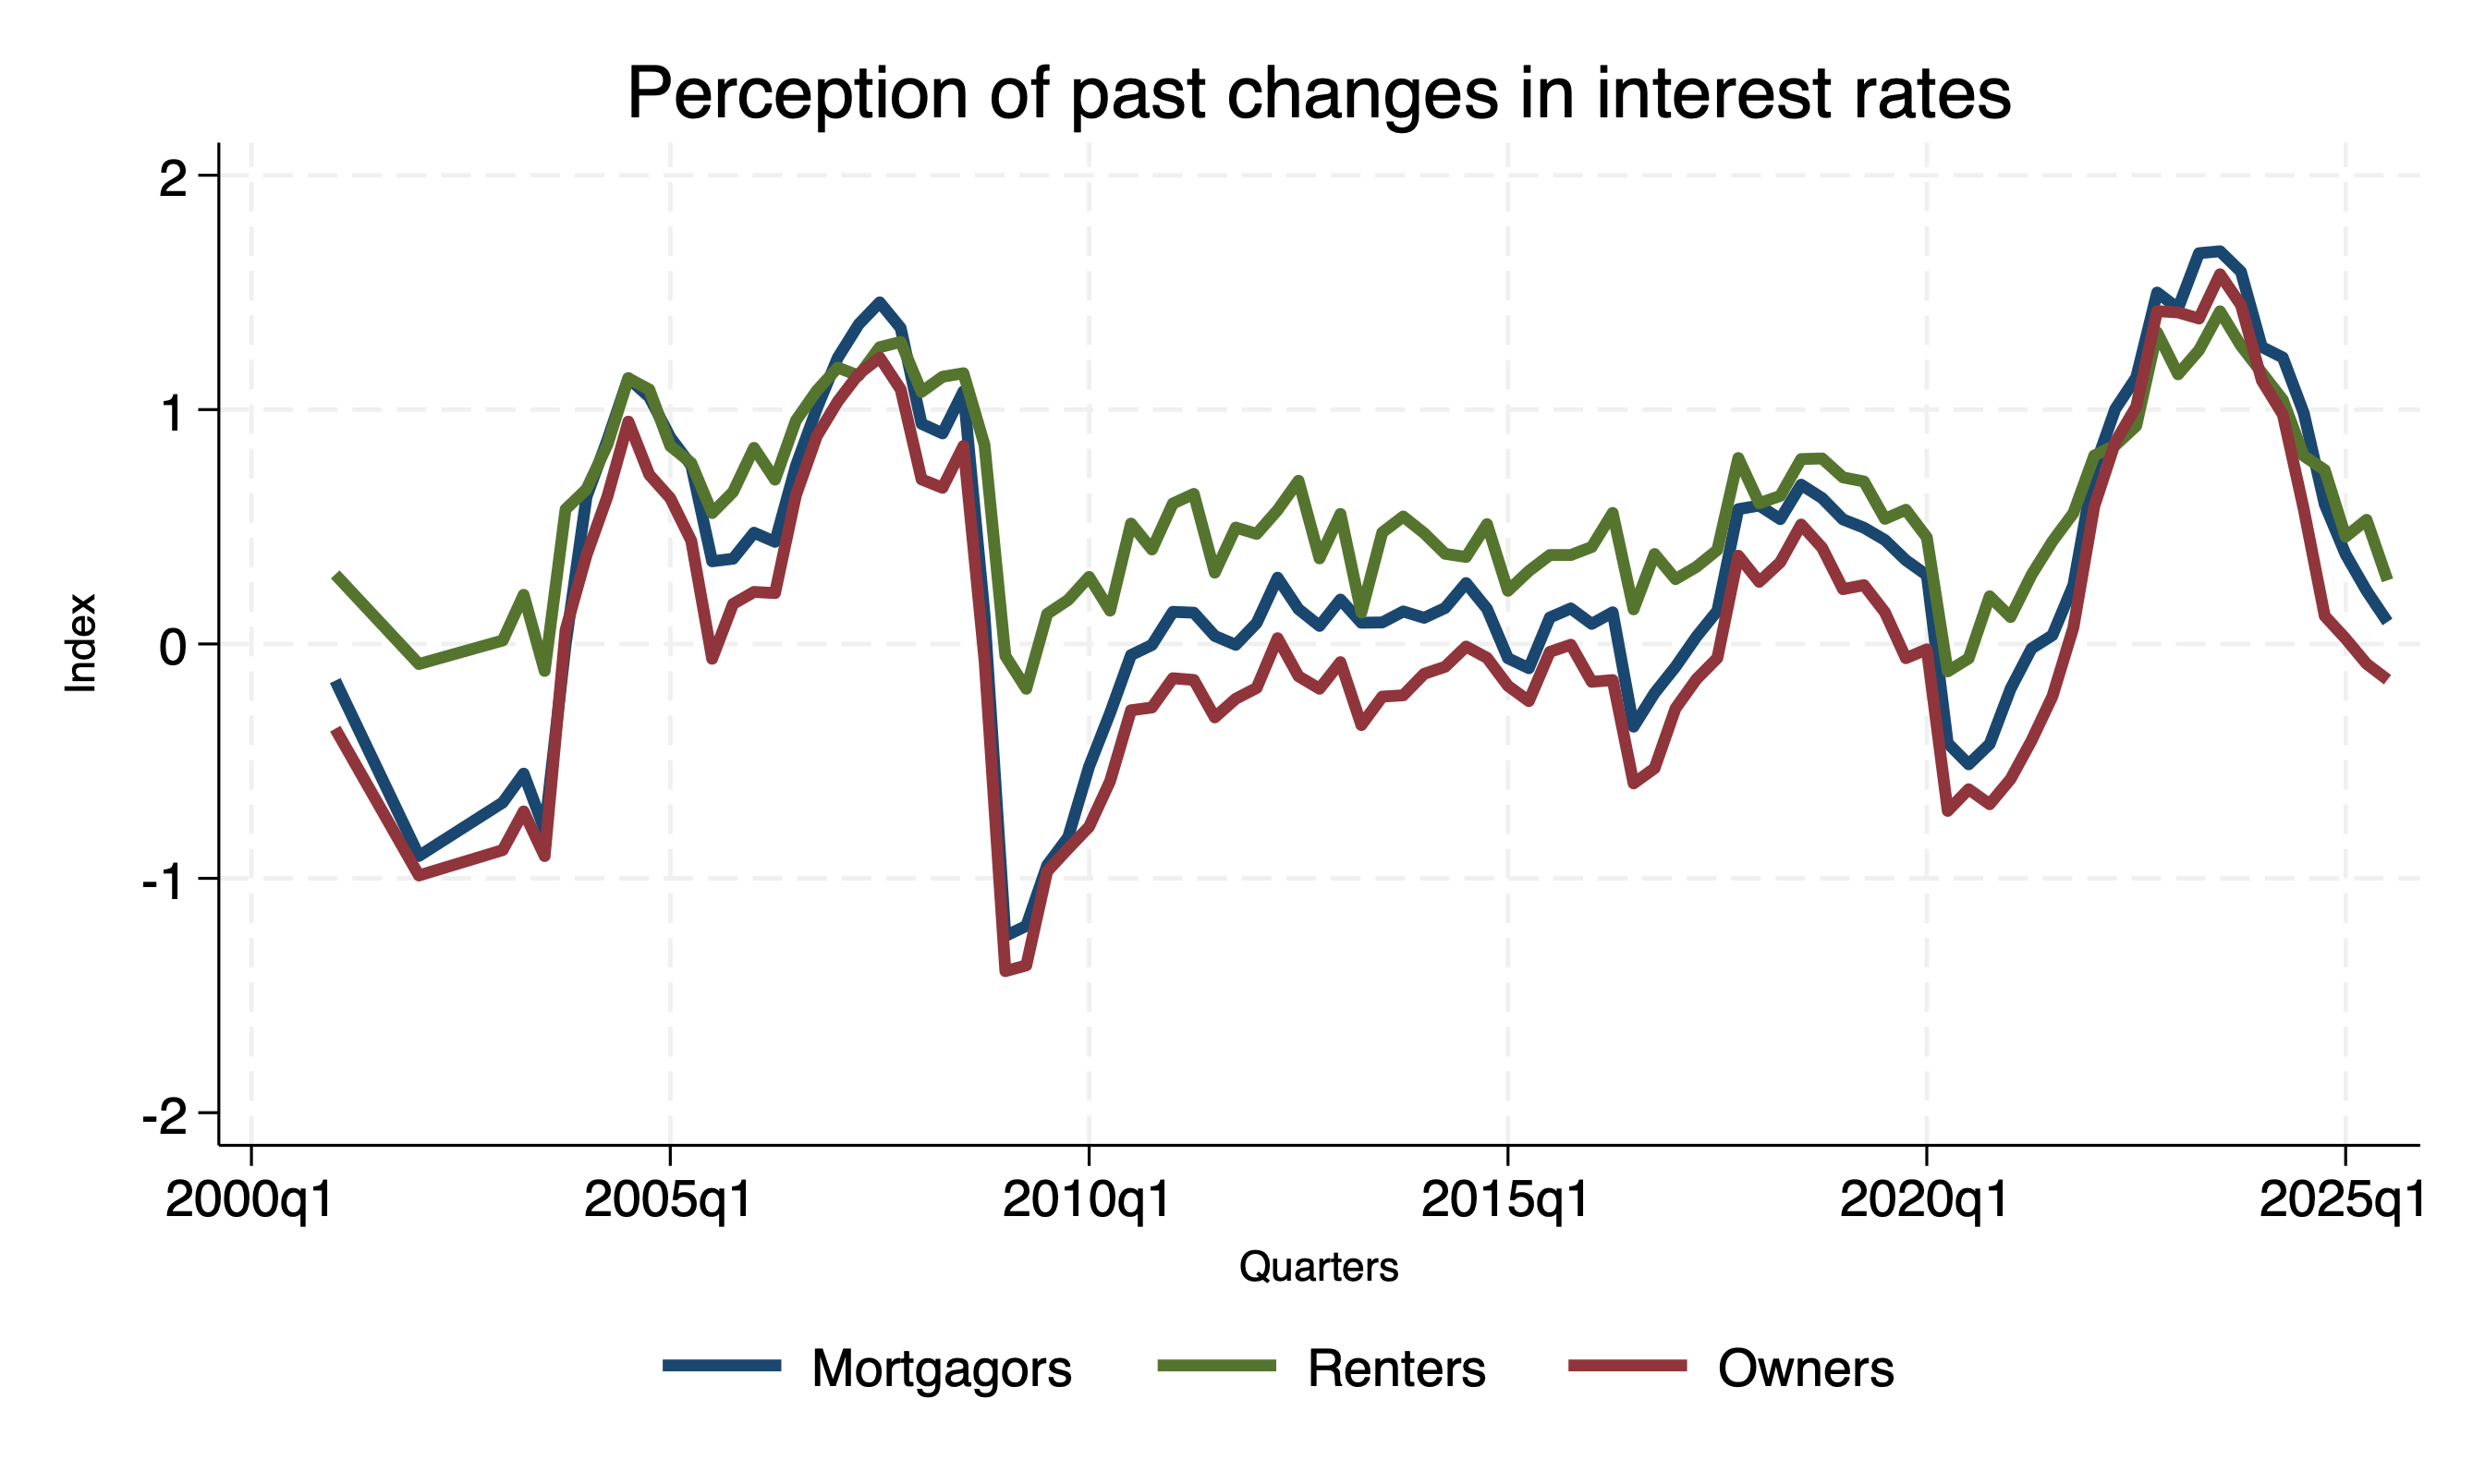
<p>For each period, I construct an index defined as the difference between the share of individuals who answered “risen” and the share who answered “fallen,” using the sample weights provided by the survey. Figure 3 presents the evolution of this index for three groups of households based on their housing tenure status. This characteristic serves as a useful proxy for balance sheet positions (<a href="https://doi.org/10.1093/restud/rdy074">Cloyne et al., 2020</a>). Mortgagors tend to be more exposed to debt, outright homeowners hold relatively more financial assets, and renters are less exposed to both assets and liabilities.</p>

<p>The evidence shows that renters are more likely to perceive that interest rates have increased, whereas outright homeowners are more likely to hold the opposite view. Mortgagors lie in between. During the Great Recession, when interest rates fell sharply, the index for renters declined only slightly and remained close to zero, indicating that many still perceived rates as increasing. Because renters are typically less exposed to financial markets and face tighter liquidity constraints, they tend to be less attentive to interest rate movements. Additionally, since mortgagors are more exposed to debt than outright homeowners (and lending rates are generally higher than saving rates) they are more likely to perceive increases in interest rates compared with homeowners.</p>

<figure class="blog-figure">
  <img src="/images/blog/interest-rates-housing-tenure.jpg" alt="Perceptions of interest-rate changes by housing tenure" />
  <figcaption>Figure 3. Perceptions of interest-rate movements by housing tenure.</figcaption>
</figure>

<p>I also compared other demographic characteristics, such as gender, education, and income. I did not find differences by gender, but individuals with lower levels of education and income are more likely to perceive an increase in interest rates.</p>

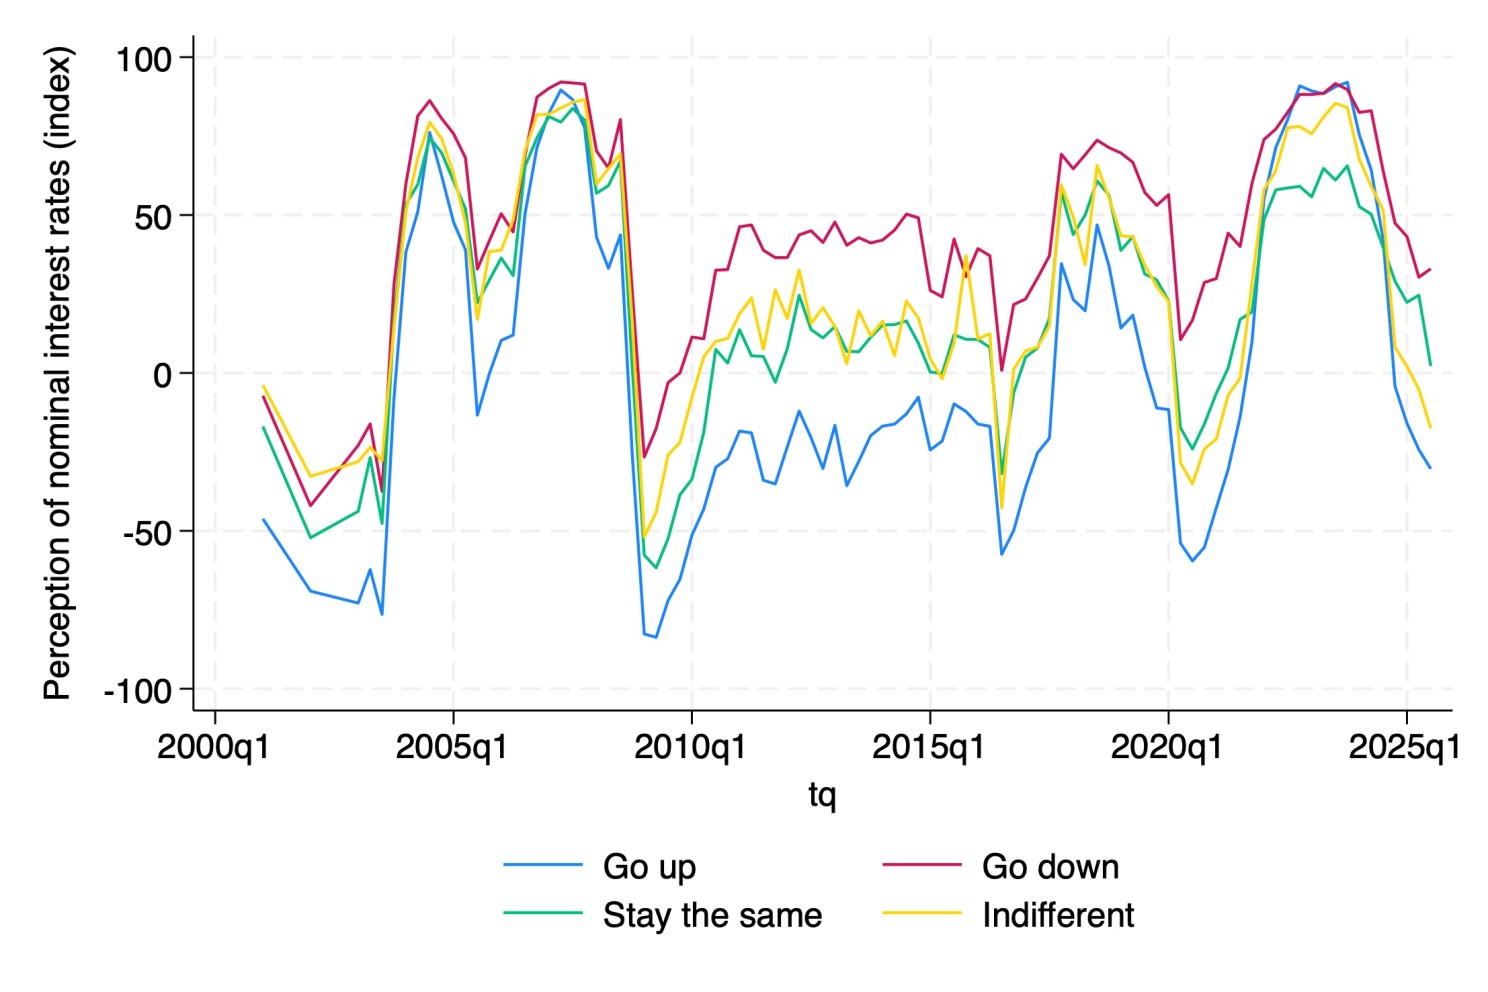
<p>Moreover, personal preferences regarding interest rate movements matter for these perceptions. Figure 4 plots the index for four groups of individuals: (i) those who prefer interest rates to rise, (ii) those who prefer them to fall, (iii) those who prefer rates to remain unchanged, and (iv) those who are indifferent to interest rate changes.</p>

<p>The results are striking: individuals who prefer interest rates to fall are more likely to perceive that rates have increased over the past year. The opposite pattern holds for those who prefer an increase in interest rates. There are no clear differences between individuals who are indifferent and those who prefer stable rates.</p>

<p>A more sophisticated analysis is required to study the causal relationship between preferences and perceptions. One possibility is that perceptions of interest rate movements shape preferences, although these preferences should also be influenced by households’ financial positions (i.e., whether they are net lenders or borrowers). Another possibility is that preferences themselves bias perceptions.</p>

<figure class="blog-figure">
  <img src="/images/blog/interest-rates-preferences.jpg" alt="Perceptions of interest-rate changes by preferred direction of rates" />
  <figcaption>Figure 4. Perceptions of interest-rate movements by interest-rate preferences.</figcaption>
</figure>

<p>These results shed light on directions for future research. For example, to better understand how the intertemporal substitution channel induced by monetary policy shapes individuals’ decisions between present and future consumption, we need to consider not only how households form expectations about inflation, but also how they perceive nominal interest rates. Since this substitution channel operates through fluctuations in the real interest rate, that is, the difference between the nominal rate and expected inflation, incorporating both elements can provide a clearer picture and help address puzzles in monetary policy transmission.</p>

<p>Additionally, this framework can improve our understanding of the effects of liquidity constraints. Some households (or specific groups) may perceive credit conditions to be worse than they actually are, leading them to self-exclude from financial markets. As a result, monetary policy could have amplified or dampened effects on consumption once these perceptions are taken into account.</p>

<h2 id="references">References</h2>

<div class="blog-references">

<p>
Cloyne, J., Ferreira, C., &amp; Surico, P. (2020).
<a href="https://doi.org/10.1093/restud/rdy074">
Monetary policy when households have debt: New evidence on the transmission mechanism.
</a>
<em>The Review of Economic Studies, 87</em>(1), 102–129.
</p>

</div>]]></content><author><name>Carlos Delgado</name><email>cadelgado@tamu.edu</email></author><category term="monetary policy" /><category term="household finance" /><category term="expectations" /><category term="interest rates" /><summary type="html"><![CDATA[]]></summary></entry><entry><title type="html">The “Oven” of Macroeconomic Expectations: What Do We Know So Far?</title><link href="https://cadelgadof.github.io/posts/2026/03/oven-macroeconomic-expectations/" rel="alternate" type="text/html" title="The “Oven” of Macroeconomic Expectations: What Do We Know So Far?" /><published>2026-03-29T00:00:00+00:00</published><updated>2026-03-29T00:00:00+00:00</updated><id>https://cadelgadof.github.io/posts/2026/03/oven-macroeconomic-expectations</id><content type="html" xml:base="https://cadelgadof.github.io/posts/2026/03/oven-macroeconomic-expectations/"><![CDATA[<!--more-->

<p>Households form expectations about the evolution of economic outcomes when making decisions regarding consumption, saving, and indebtedness. This process is not exclusive to economists, although the methods used may differ. Analyzing how households form expectations is not merely an academic exercise; rather, it is essential for better understanding the dynamics of business cycles and the transmission of macroeconomic policy. In the United States, private consumption accounted for 68.5% of nominal GDP in December 2025. Consequently, more than two-thirds of output depends largely on household decisions <a href="https://www.ceicdata.com/en/indicator/united-states/private-consumption--of-nominal-gdp">(CEIC Data, n.d.)</a>.</p>

<p>Whereas professional forecasters tend to use statistical and econometric tools to project variables such as output, inflation, and unemployment, households make decisions based on the signals they receive from their surroundings. For example, the recent oil shock associated with the Iran conflict has affected countries around the world, and information about its economic impact has been conveyed not only through more formal and aggregated sources, such as central banks and governments, but also through local and informal channels, such as social media and conversations with peers.</p>

<figure>
  <img src="/images/pexels-jonathanborba-14242081.jpg" alt="Bread baking in an oven" style="width:100%; border-radius:4px;" />
</figure>

<p>In my view, expectation formation can be thought of as an oven: signals serve as the ingredients (information inputs), while individuals’ mental models of the economy, including their perceptions of how variables interact, correspond to the oven settings (such as temperature, timing, and conditions). The resulting expectations about future outcomes are the final dish.</p>

<p>Academic research introduced the concept of rational expectations <a href="https://www.jstor.org/stable/1909635">(Muth, 1961)</a>, which posits that individuals use all available information and understand the true structure of the economy when forecasting variables. When shocks occur, agents update their beliefs accordingly and, on average, do not make systematic errors. In the cooking analogy, this is akin to knowing all available ingredients, both at home and in supermarkets (including all brands), as well as all existing recipes for cakes. Consequently, after cooking, one should obtain a cake that closely resembles the outcome described in the recipe.</p>

<p>Over time, alternative approaches to expectation formation have emerged. Assuming that individuals know and process all available information is unrealistic; even if such information were accessible, processing it is cognitively and time intensive, particularly in an environment characterized by vast amounts of data. For these reasons, the concept of rational inattention <a href="https://doi.org/10.1016/S0304-3932(03)00029-1">(Sims, 2003)</a> has gained prominence. This framework posits that agents make the best possible predictions subject to constraints on information acquisition and processing <a href="https://www.aeaweb.org/articles?id=10.1257/jel.20211524">(Maćkowiak et al., 2023)</a>. As a result, individuals selectively allocate attention, prioritizing certain sources of information over others to reduce uncertainty as effectively as possible.</p>

<p>Returning to the analogy, learning new recipes requires time and effort that may not always be available. Instead, individuals tend to prepare satisfactory dishes using familiar ingredients and recipes they already know.</p>

<p>Some strands of the literature define all expectations that are not rational as “behavioral expectations.” In my view, this terminology is not ideal, because behavior refers to any action or decision made by an individual, regardless of whether it is considered rational. In this sense, the formation of expectations about economic variables is itself a form of behavior.</p>

<p>I therefore prefer the term subjective expectations. The Merriam-Webster dictionary defines “subjective” as “relating to or being experience or knowledge as conditioned by personal mental characteristics or states”. Accordingly, expectation formation is based on a set of experiences and knowledge shaped by how individuals perceive the world.</p>

<p>I would not characterize subjective expectations as inherently “worse” than rational expectations ex ante. Rather, expectation formation should be evaluated based on its consequences for individuals’ well-being, as an ex post exercise.</p>

<p>What do we know about subjective expectations? The standard approach to eliciting them is through surveys of households. Additionally, advances in Large Language Model (LLM) techniques allow researchers to infer these perceptions and expectations from “field evidence,” such as social media, books, newspapers, radio, and television. I refer to the first approach as an active method and the second as a passive method of eliciting expectations.</p>

<p>The literature has established that expectations affect both perceptions and behavior. <a href="https://doi.org/10.1162/rest_a_00867">Roth and Wohlfart (2020)</a> expose a sample of individuals to information treatments featuring high or low forecasts of the probability of a recession. Although households exhibit more pessimistic and more dispersed priors about recession probabilities compared with professional forecasters, they update their beliefs in the direction of the information provided. The authors also document a negative effect on individuals’ subjective financial prospects, particularly regarding the perceived probability of becoming unemployed. This effect is stronger among individuals with greater exposure to past recessions, lower levels of education, lower earnings, and is more pronounced for men.</p>

<p>Preferences regarding changes in economic variables and policy also play an important role in shaping subjective expectations. <a href="https://doi.org/10.26509/frbc-wp-202512">Pfajfar and Winkler (2025)</a> find that perceptions of the U.S. inflation target differ from the official one: respondents tend to believe that the target is 3%, rather than 2%. In addition, a non-negligible share of respondents considers deflation to be an optimal target.</p>

<p>Regarding preferences, most individuals report that lower inflation is either better or at least no worse for them. Preferences concerning unemployment are concentrated around an indifference point, with the modal response indicating that a reduction in unemployment would not significantly affect their well-being. Finally, preferences over interest rate changes are heterogeneous across households, with some preferring lower rates and others favoring higher ones.</p>

<p>When asked to choose between reducing inflation or unemployment, but not both, more than 80% of respondents prefer a reduction in inflation. More specifically, the authors estimate an acceptable sacrifice ratio for U.S. households of 0.69. This implies that, to reduce inflation by 1 percentage point, households are willing to accept an increase in the unemployment rate of 0.69 percentage points. This ratio is lower than those typically used in standard monetary policy loss functions.</p>

<p>Moreover, the sacrifice ratio is higher during periods of elevated inflation and among individuals with higher education and numeracy levels, as well as retirees. In contrast, it is lower for women and Latino individuals. Incorporating these findings into central banks’ loss functions would imply that optimal monetary policy places relatively greater weight on stabilizing unemployment, at least three times more, compared with standard models.</p>

<p>One aspect that it is interesting to analyze is the process of joint expectations, I mean, where the expectation formation of one variable does not depend only of the past realizations of the same variable, but also from others. The most common pair is the association between inflation and unemployment. There is evidence stating that households forecast higher future unemployment rates after experience a higher inflation setting. This is due to they associate supply-side mechanisms under this relationship, where they consider a higher inflation as an anticipation of worse outcomes.</p>

<p>Individuals perceive the impact of macroeconomic shocks in different ways. <a href="https://doi.org/10.1093/restud/rdac008">Andre et al. (2022)</a> compare the subjective models of households with those of experts (academics and professional forecasters) in response to several hypothetical shocks, including an oil supply shock, a monetary policy shock, a government spending shock, and an income tax shock. Experts tend to interpret the effects of these shocks on inflation and unemployment in line with standard textbook models. In contrast, households often rely on different mechanisms to explain these effects, leading to predictions that differ from conventional evidence. For example, a large share of households in the survey report that, following a contractionary monetary policy shock, both inflation and unemployment increase. A similar perception is observed in response to an increase in income taxes.</p>

<p>The authors conclude that individuals selectively retrieve certain propagation mechanisms of shocks while neglecting others. This pattern is referred to as selective memory. In other words, individuals tend to focus on channels that are typically considered less central in standard models. In the case of monetary policy, households often associate higher interest rates with higher inflation, invoking a cost channel in which firms raise prices due to increased borrowing costs.</p>

<p>The paper also finds that contextual cues influence forecasts by altering the channels individuals retrieve, a mechanism referred to as associative memory.</p>

<p>What are the perceived links between recessions and inflation? According to the data, most past recessions have been associated with disinflation. However, <a href="https://doi.org/10.1162/rest_a_00867">Roth and Wohlfart (2020)</a> find that households’ beliefs about the probability of a recession do not significantly affect their inflation expectations. The authors conclude that consumers may not be sufficiently sophisticated to account for complex relationships between macroeconomic variables when forming their beliefs.</p>

<p>One strand of the literature models subjective expectations ex ante, where a hypothesis is first formulated and then tested using data. Another strand adopts an ex post approach, seeking to uncover subjective models from observed expectations data using generalization techniques.</p>

<p>In this vein, <a href="https://www.bankofcanada.ca/wp-content/uploads/2025/11/swp2025-31.pdf">Hou and Wang (2025)</a> propose a test of joint expectation formation by extending a Kalman filter to a multivariate setting. The authors find that households associate higher inflation with subsequent episodes of high unemployment, but not the reverse. Moreover, under this pattern of expectations, joint learning generates amplified responses to standard supply shocks relative to an independent learning process, while the response to demand shocks is dampened.</p>

<p>In conclusion, research on macroeconomic subjective expectations is still evolving. Its development has progressed alongside advances in methods for eliciting expectations about aggregate variables. Most studies have focused on inflation and unemployment, but there is considerable scope to analyze how households perceive other variables, such as government spending, interest rates, and taxes.</p>

<p>There is also room to further explore the subjective processes underlying macroeconomic uncertainty. Although the literature does not provide a clear consensus on the impact of uncertainty on inflation, examining this relationship through the lens of expectations may help resolve this puzzle.</p>

<p>Ultimately, we need to continue uncovering the “ovens” that each household uses, as well as the “recipes” and “ingredients” that shape their expectations.</p>

<h2 id="references">References</h2>

<div class="blog-references">

<p>
Andre, P., Pizzinelli, C., Roth, C., &amp; Wohlfart, J. (2022).
<a href="https://doi.org/10.1093/restud/rdac008">
Subjective models of the macroeconomy: Evidence from experts and representative samples.
</a>
<em>The Review of Economic Studies, 89</em>(6), 2958–2991.
</p>

<p>
Bhandari, A., Borovička, J., &amp; Ho, P. (2025).
<a href="https://doi.org/10.1093/restud/rdae054">
Survey data and subjective beliefs in business cycle models.
</a>
<em>Review of Economic Studies, 92</em>(3), 1375–1437.
</p>

<p>
CEIC Data. (n.d.).
<a href="https://www.ceicdata.com/en/indicator/united-states/private-consumption--of-nominal-gdp">
United States: Private consumption (% of nominal GDP).
</a>
Retrieved March 28, 2026.
</p>

<p>
Hou, C., &amp; Wang, T. (2025).
<a href="https://www.bankofcanada.ca/wp-content/uploads/2025/11/swp2025-31.pdf">
Uncovering subjective models from survey expectations.
</a>
Bank of Canada Staff Working Paper No. 2025-31.
</p>

<p>
Maćkowiak, B., Matějka, F., &amp; Wiederholt, M. (2023).
<a href="https://www.aeaweb.org/articles?id=10.1257/jel.20211524">
Rational inattention: A review.
</a>
<em>Journal of Economic Literature, 61</em>(1), 226–273.
</p>

<p>
Muth, J. F. (1961).
<a href="https://www.jstor.org/stable/1909635">
Rational expectations and the theory of price movements.
</a>
<em>Econometrica, 29</em>(3), 315–335.
</p>

<p>
Pfajfar, D., &amp; Winkler, F. (2025).
<a href="https://doi.org/10.26509/frbc-wp-202512">
Households' preferences over inflation and monetary policy tradeoffs.
</a>
Federal Reserve Bank of Cleveland Working Paper No. 25-12.
</p>

<p>
Roth, C., &amp; Wohlfart, J. (2020).
<a href="https://doi.org/10.1162/rest_a_00867">
How do expectations about the macroeconomy affect personal expectations and behavior?
</a>
<em>Review of Economics and Statistics, 102</em>(4), 731–748.
</p>

<p>
Sims, C. A. (2003).
<a href="https://doi.org/10.1016/S0304-3932(03)00029-1">
Implications of rational inattention.
</a>
<em>Journal of Monetary Economics, 50</em>(3), 665–690.
</p>

</div>]]></content><author><name>Carlos Delgado</name><email>cadelgado@tamu.edu</email></author><category term="expectations" /><category term="household finance" /><category term="macroeconomics" /><category term="monetary policy" /><summary type="html"><![CDATA[]]></summary></entry><entry><title type="html">Housing Tenure and Monetary Policy Preferences in the UK</title><link href="https://cadelgadof.github.io/posts/2026/02/housing-tenure-monetary-policy-preferences-uk/" rel="alternate" type="text/html" title="Housing Tenure and Monetary Policy Preferences in the UK" /><published>2026-02-25T00:00:00+00:00</published><updated>2026-02-25T00:00:00+00:00</updated><id>https://cadelgadof.github.io/posts/2026/02/housing-tenure-monetary-policy-preferences-uk</id><content type="html" xml:base="https://cadelgadof.github.io/posts/2026/02/housing-tenure-monetary-policy-preferences-uk/"><![CDATA[<!--more-->

<p>Individuals hold opinions about monetary policy decisions. Although policymakers focus on the evolution of aggregate variables such as output, inflation, and unemployment, households face different realities in terms of income levels and net financial wealth. As a result, they may have different preferences regarding the path of policy rates, which can diverge from general equilibrium objectives.</p>

<p>In this blog, I present some stylized facts about households’ opinions on monetary policy. I focus on the case of the United Kingdom (UK) and use data from the Bank of England’s Inflation Attitudes Survey (IAS) to measure households’ preferences regarding changes in both interest rates and inflation.</p>

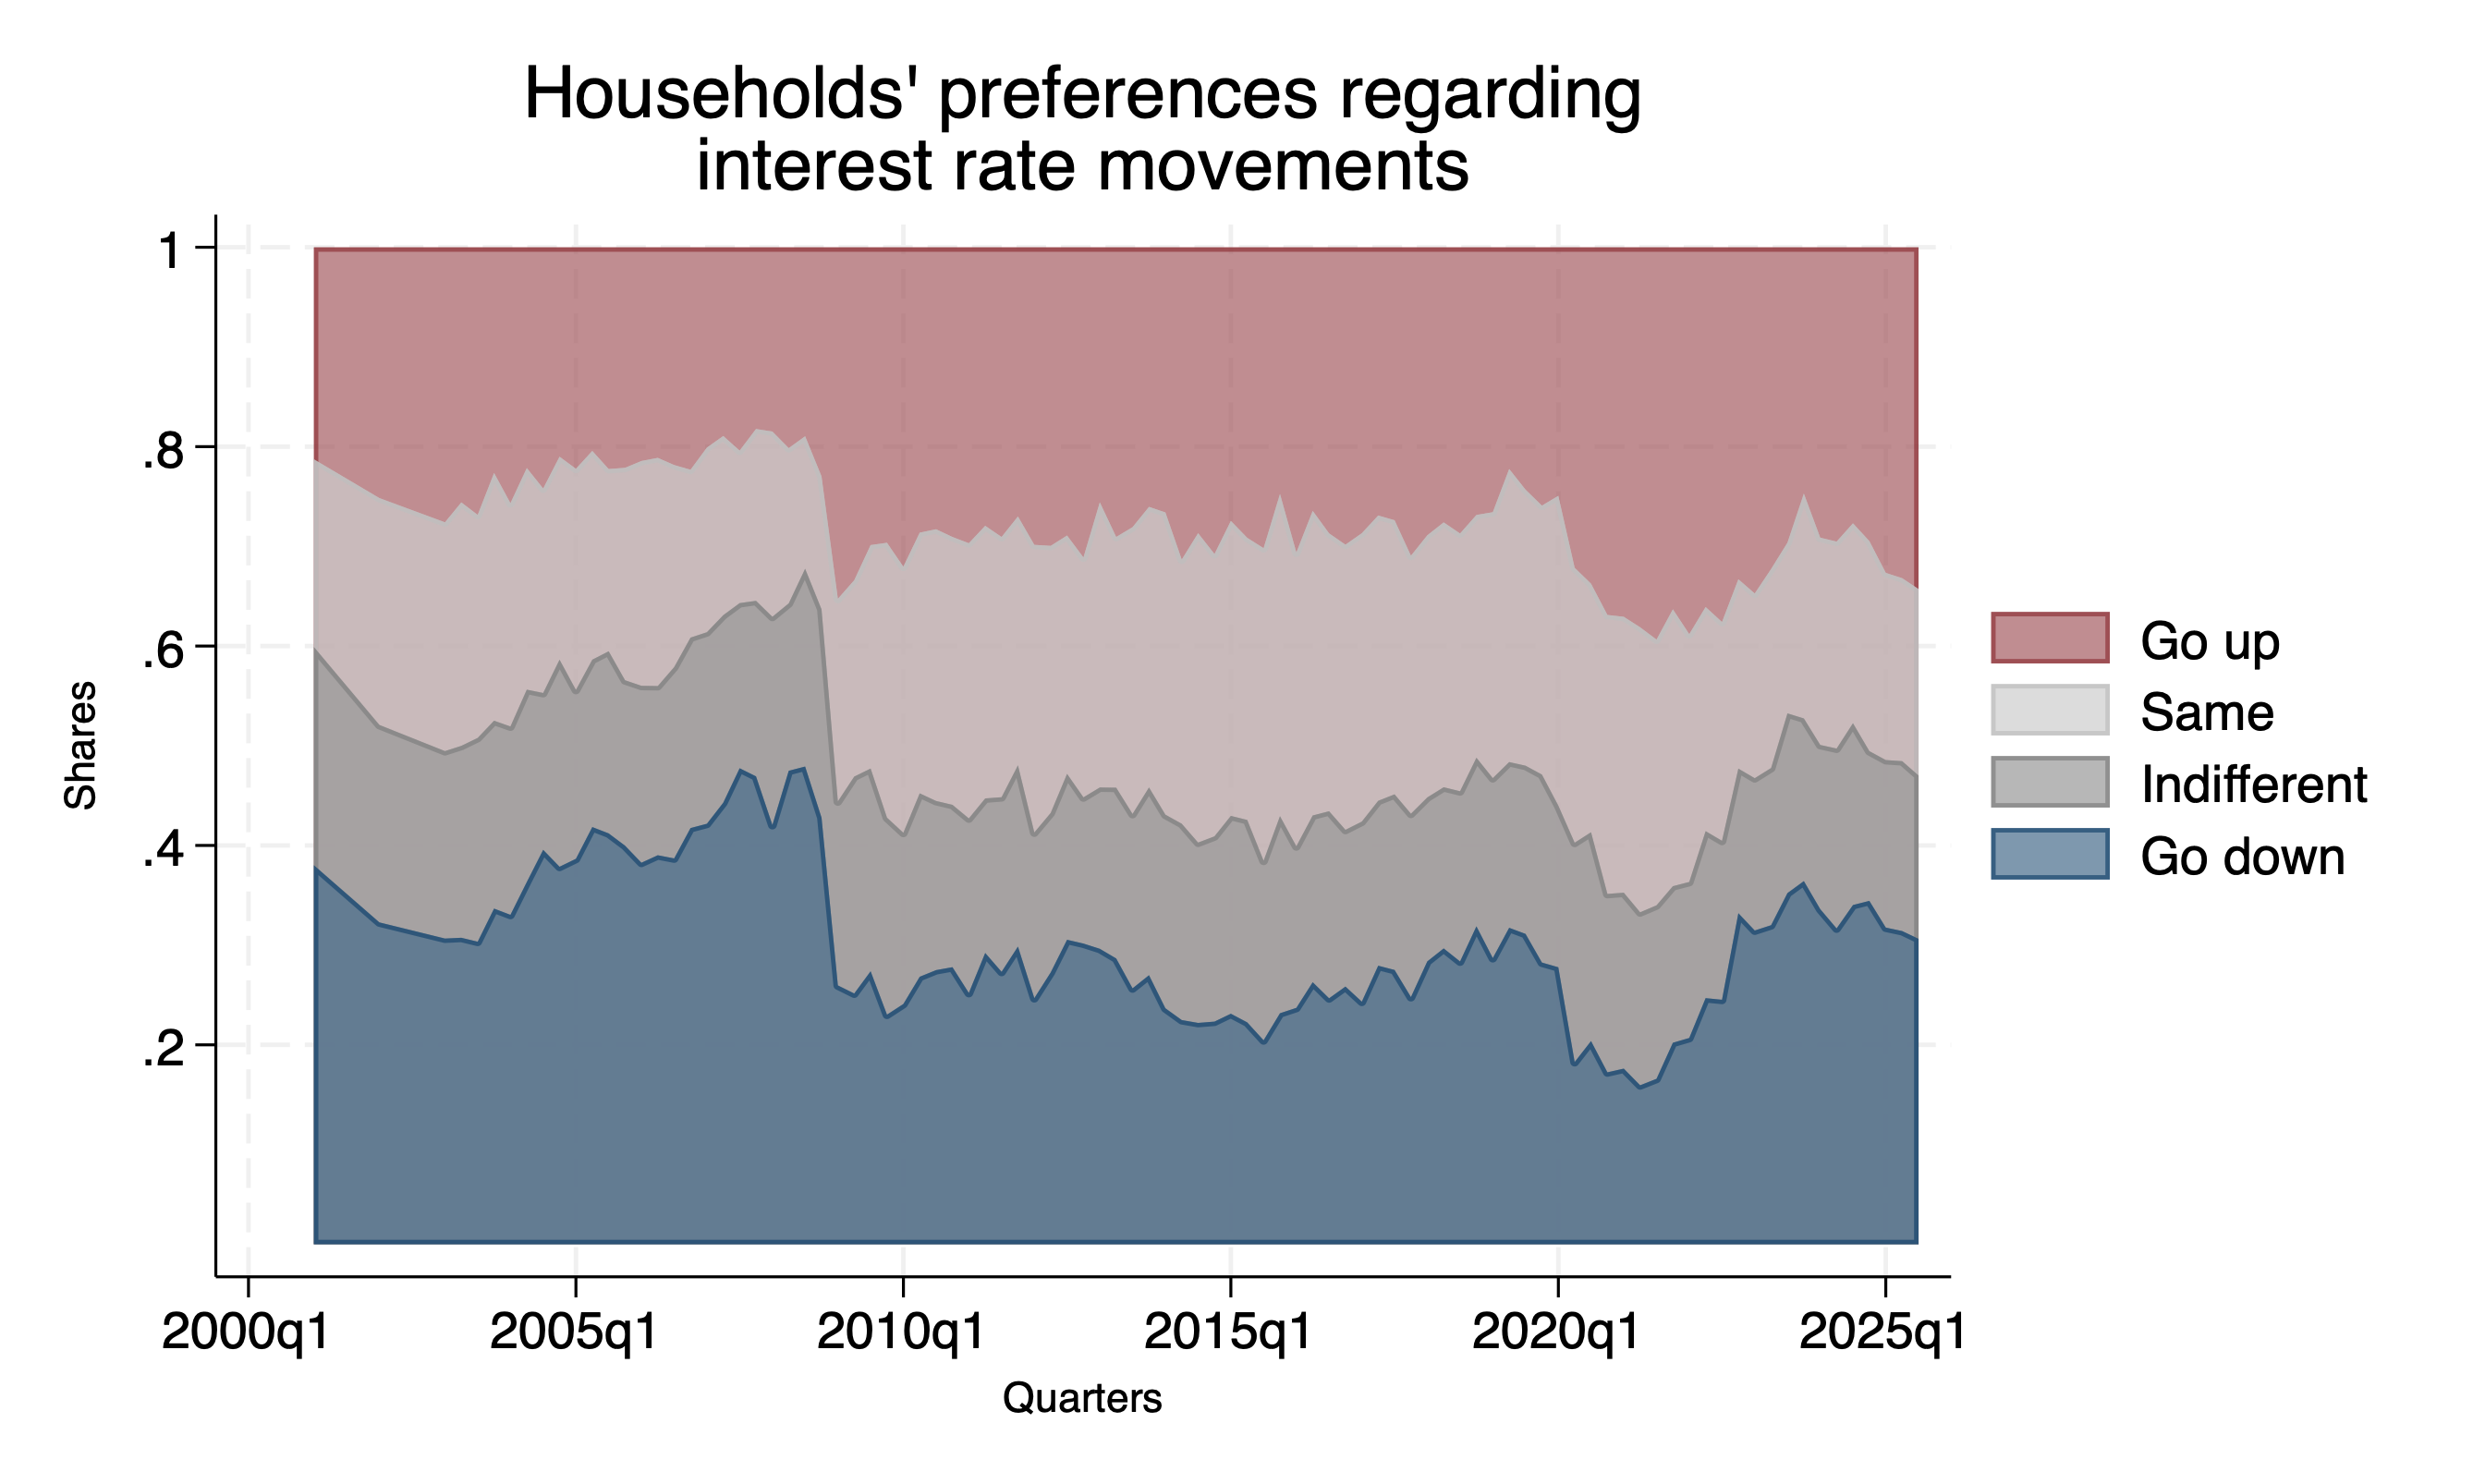
<p>First, consider preferences over interest rate movements. The figure below reports the shares of responses to the following question: <em>And which would be best for you personally—for interest rates to go up over the next few months, or to go down, or to stay where they are now, or would it make no difference either way?</em></p>

<p><img src="/images/all_pref.png" alt="Households' preferences regarding interest rate movements" /></p>

<p><em>Figure 1. Households’ preferences regarding interest rate movements.</em></p>

<p>The share of responses indicating indifference toward interest rate movements remains relatively stable over time. However, there is a structural break in the aftermath of the Great Recession. In the period prior to the crisis, there was a clear upward trend in the share of respondents preferring lower interest rates. After the crisis, this trend reverses, accompanied by a higher share of responses favoring higher interest rates and a relatively stable share preferring no change.</p>

<p>This pattern is consistent with the fact that central banks implemented highly expansionary monetary policies to counter the crisis. A similar pattern emerged during the Covid-19 pandemic, which can also be explained by the subsequent surge in inflation.</p>

<p>To analyze heterogeneity across households, we can consider several dimensions, such as income, age (to capture life-cycle effects), education, and gender, among others. In this post, I focus on housing tenure status, classifying individuals into three groups: renters, mortgagors, and outright homeowners (hereafter, owners). This characteristic not only reflects households’ property wealth but also their balance sheet positions.</p>

<p>Owners hold substantial housing wealth and typically higher net financial wealth, making them net savers with easier access to financial markets. Mortgagors, in contrast, are wealthier in terms of housing assets but face debt obligations and collateral constraints, making them net borrowers. Finally, renters generally do not own property and tend to hold fewer financial assets compared with the other groups <a href="https://academic.oup.com/restud/article/87/1/102/5272505">(Cloyne et al., 2020)</a>.</p>

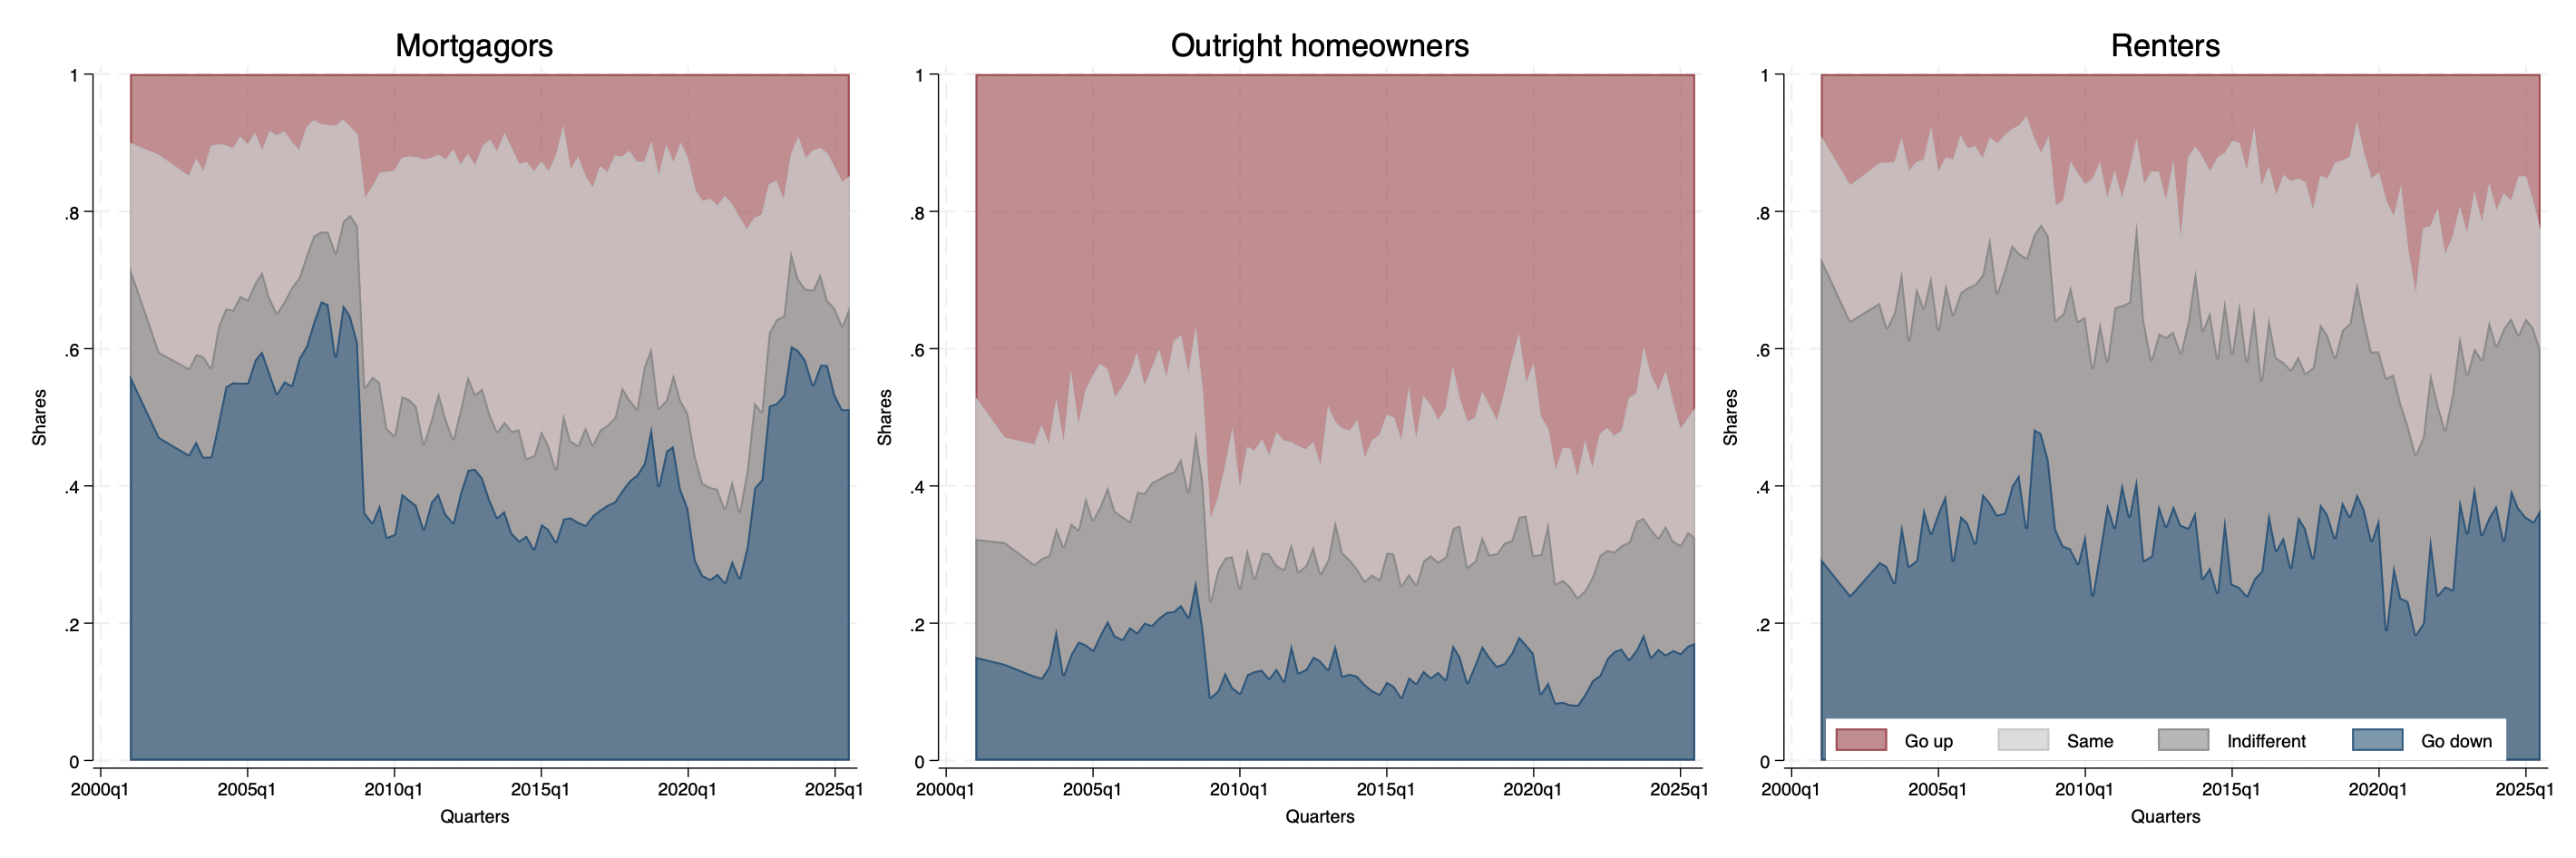
<p>Given these differences in financial positions, households may also differ in their preferences regarding interest rate movements. The next figure presents the shares by housing tenure group and reveals several interesting patterns.</p>

<p><img src="/images/tenure_pref.png" alt="Housing tenure and interest-rate preferences" /></p>

<p><em>Figure 2. Preferences regarding interest-rate movements by housing tenure.</em></p>

<p>Mortgagors show a stronger preference for interest rates to decrease. This is straightforward to understand, as they seek lower interest payments, especially in the UK, where most mortgage contracts are adjustable-rate <a href="https://onlinelibrary.wiley.com/doi/full/10.1111/j.1538-4616.2011.00391.x">(Rubio, 2011)</a>, making them highly sensitive to monetary policy decisions. The next most common preference among mortgagors is for interest rates to remain stable. They may value lower uncertainty in economic conditions to better manage their borrowing commitments.</p>

<p>Owners exhibit the opposite pattern: roughly half clearly prefer higher interest rates. There are two potential explanations for this. First, as net savers, higher interest rates are associated with higher returns on savings. Second, since higher interest rates tend to stabilize inflation, owners may prefer greater price stability to avoid erosion of the real value of their financial assets.</p>

<p>Finally, renters do not display a clear preference regarding interest rate movements; the dispersion of responses is relatively even. Nevertheless, they are the group with the highest proportion of respondents indicating indifference to rate changes. This may reflect their more limited participation in financial markets, given their lower borrowing and saving rates. They may instead prioritize other macroeconomic variables, such as the unemployment rate. At the same time, renters tend to prefer interest rate reductions over increases, possibly reflecting a desire to access borrowing markets in the future, particularly if they aim to purchase a home.</p>

<p>What about perceptions of past interest rate movements by housing tenure? The IAS includes the following question: <em>I would now like to ask about interest rates. How would you say interest rates on things such as mortgages, bank loans, and savings have changed over the last twelve months?</em></p>

<p>I construct an index ranging from −2 to 2 based on the responses to this question. Negative values indicate an aggregate perception that interest rates have decreased, positive values indicate perceived increases, and values close to zero reflect a perception of little or no change.</p>

<p><img src="/images/Graph.png" alt="Perception of past changes in interest rates" /></p>

<p><em>Figure 3. Perception of past changes in interest rates by housing tenure.</em></p>

<p>The trend is broadly similar across groups and reflects the aggressive monetary policy responses during the Great Recession, the Covid-19 pandemic, and the subsequent inflation surge. However, there are cross-group differences in the magnitude of these perceptions. Mortgagors and owners exhibit relatively similar index values, whereas renters perceive interest rates as having increased more sharply than the other groups.</p>

<p>This divergence persists even during periods without major economic crises or inflation spikes. In many episodes, owners report a stronger downward correction in perceived interest rates than mortgagors. Overall, households tend to perceive changes in interest rates in a direction that contrasts with their stated preferences.</p>

<p>Finally, I would like to discuss the trade-off between interest rates and inflation. The IAS also includes the following question: <em>If a choice had to be made either to raise interest rates to try to keep inflation down, or keep interest rates down and allow prices in the shops to rise faster, which would you prefer?</em></p>

<p>The next figure shows the evolution of the share of households who prefer higher interest rates in order to stabilize inflation. The remaining share corresponds to individuals who prefer lower interest rates, even at the cost of higher inflation.</p>

<p><img src="/images/pref_rate_inf.png" alt="Preference for higher interest rates relative to higher inflation" /></p>

<p><em>Figure 4. Share of households who prefer higher interest rates to higher inflation.</em></p>

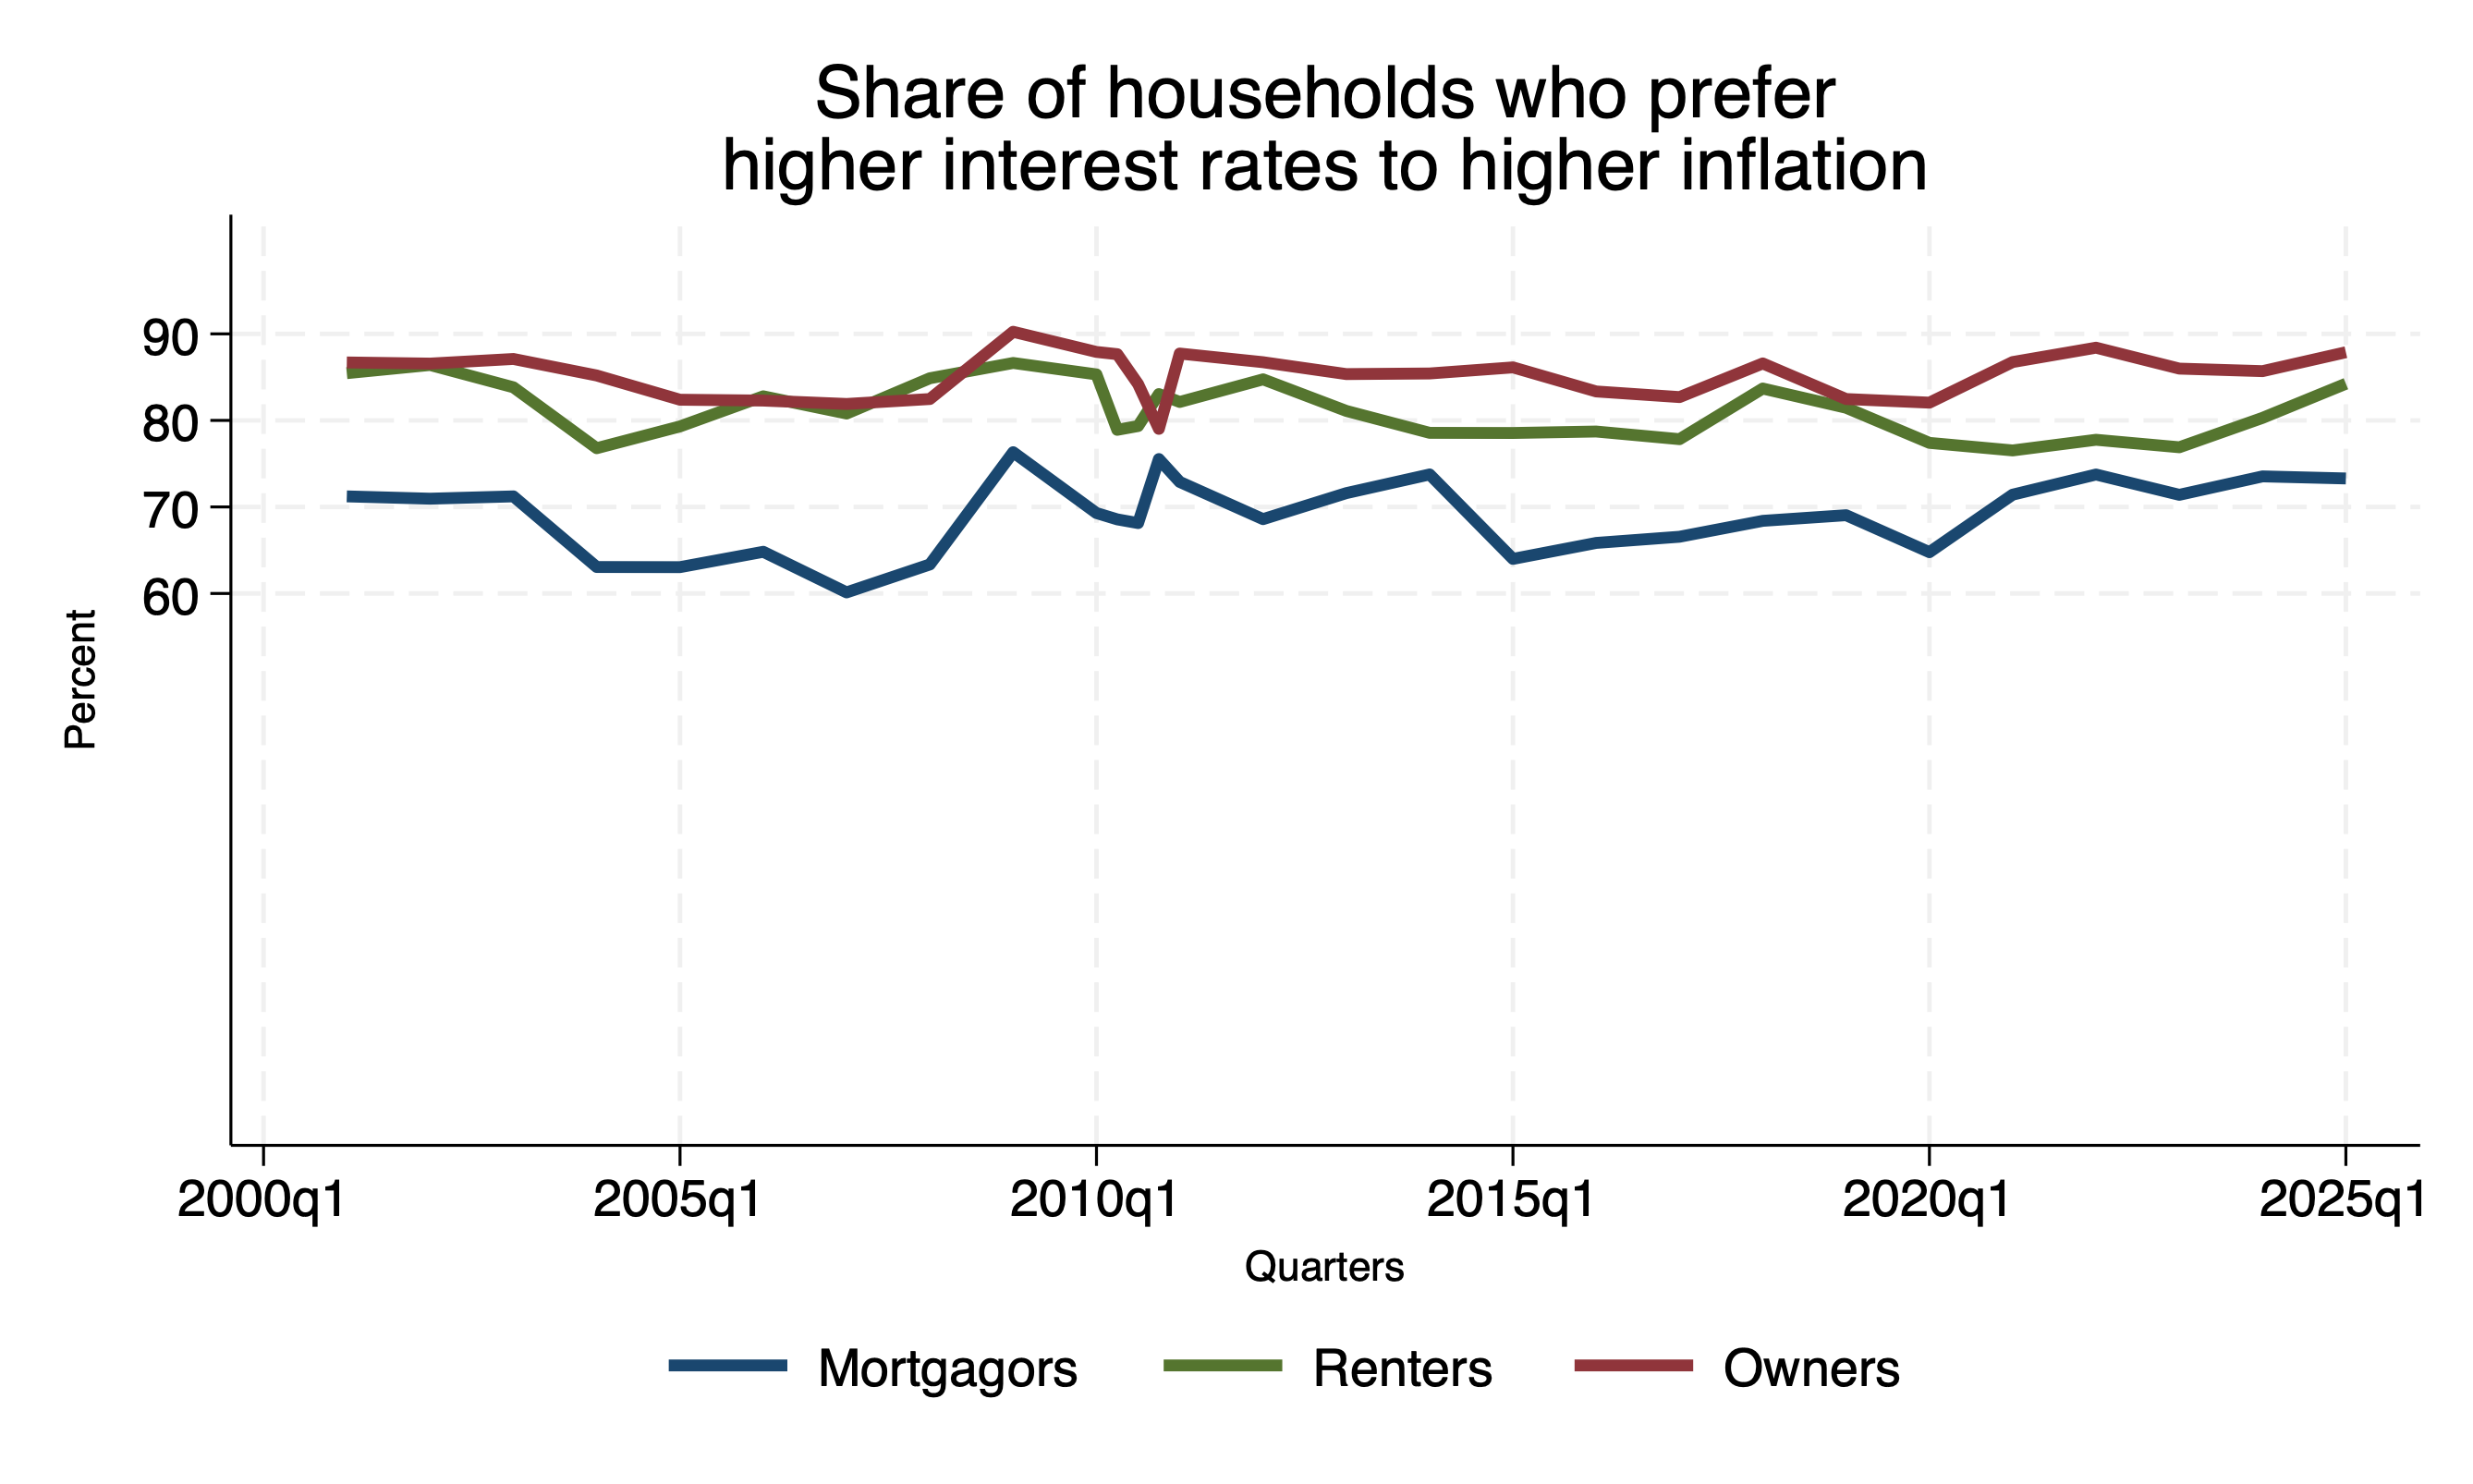
<p>The results indicate that the shares remain relatively stable over time and across groups. Despite changes in macroeconomic conditions and episodes of high inflation, households tend to maintain consistent preferences, with a clear predominance in favor of inflation stabilization, even if this requires higher interest rates. The proportion of respondents supporting this view ranges between 60% and 90%.</p>

<p>In other words, the evidence points to a strong aversion to inflation. However, mortgagors exhibit a lower share of this preference (approximately 10 percentage points less than the other groups). This may be explained by their debt exposure, as higher interest rates directly affect their budgets.</p>

<p>The divergence in preferences regarding interest rate movements may affect the process of subjective expectation formation. In this sense, not only the level of attention that households pay to macroeconomic variables matters, but also their preferences and value judgments about policies may contribute to heterogeneity in expectations.</p>

<h2 id="references">References</h2>

<div class="blog-references">

<p>
Cloyne, J., Ferreira, C., &amp; Surico, P. (2020).
<a href="https://academic.oup.com/restud/article/87/1/102/5272505">
Monetary policy when households have debt: New evidence on the transmission mechanism.
</a>
<em>The Review of Economic Studies, 87</em>(1), 102–129.
</p>

<p>
Rubio, M. (2011).
<a href="https://onlinelibrary.wiley.com/doi/full/10.1111/j.1538-4616.2011.00391.x">
Fixed- and variable-rate mortgages, business cycles, and monetary policy.
</a>
<em>Journal of Money, Credit and Banking, 43</em>(4), 657–688.
</p>

</div>]]></content><author><name>Carlos Delgado</name><email>cadelgado@tamu.edu</email></author><category term="monetary policy" /><category term="household finance" /><category term="housing tenure" /><category term="expectations" /><category term="United Kingdom" /><summary type="html"><![CDATA[]]></summary></entry><entry><title type="html">From Uncertainty to Expectations: How Do Households Think About Inflation?</title><link href="https://cadelgadof.github.io/posts/2026/01/from-uncertainty-to-expectations/" rel="alternate" type="text/html" title="From Uncertainty to Expectations: How Do Households Think About Inflation?" /><published>2026-01-28T00:00:00+00:00</published><updated>2026-01-28T00:00:00+00:00</updated><id>https://cadelgadof.github.io/posts/2026/01/from-uncertainty-to-expectations</id><content type="html" xml:base="https://cadelgadof.github.io/posts/2026/01/from-uncertainty-to-expectations/"><![CDATA[<!--more-->

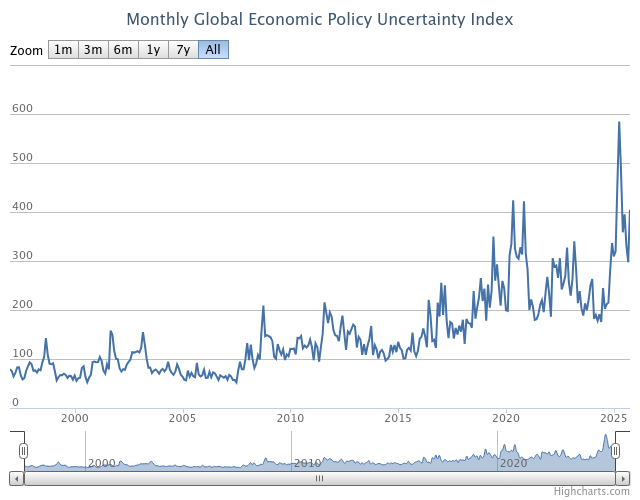
<p>Nowadays, uncertainty is no longer an isolated or transitory phenomenon. Instead, it has become a persistent feature of the economy, especially during the 2020s. The Economic Policy Uncertainty (EPU) index <a href="https://doi.org/10.1093/qje/qjw024">(Baker et al., 2016)</a> exhibits a clear upward trend (see Figure 1), and measures of macroeconomic uncertainty from <a href="https://www.aeaweb.org/articles?id=10.1257/aer.20131193">Jurado et al. (2015)</a> display record-breaking spikes in recent years. Empirical evidence shows that uncertainty shocks affect realized economic outcomes and are important drivers of macroeconomic fluctuations <a href="https://doi.org/10.1016/j.euroecorev.2016.02.020">(Caldara et al., 2016)</a>. However, because agents form expectations about future variables when making decisions, uncertainty may also play a crucial role in shaping their forecasts.</p>

<p><img src="/images/global_epu.png" alt="Monthly Global Economic Policy Uncertainty Index" /></p>

<p><em>Figure 1. Monthly Global Economic Policy Uncertainty Index.</em></p>

<p>Against this backdrop, I am interested in how rising uncertainty affects the expectations that households form about key macroeconomic variables. Among the set of variables that households forecast for decision making, this blog focuses on inflation. The ability to forecast inflation is important for individuals’ financial well-being <a href="https://doi.org/10.1111/j.1745-6606.2010.01174.x">(Bruine de Bruin et al., 2010)</a>. According to the intertemporal substitution channel, households choose the timing of real consumption based on fluctuations in the real interest rate, that is, the difference between the nominal interest rate and expected inflation. When inflation expectations rise (ceteris paribus), the real interest rate declines, or is at least perceived to decline, leading households to prefer higher current consumption due to lower borrowing costs. This mechanism has been empirically documented for durable goods consumption <a href="https://doi.org/10.1086/718982">(Coibion et al., 2022)</a>. Complementarily, individuals who anticipate rising house prices are more likely to increase their spending, particularly those facing borrowing constraints <a href="https://doi.org/10.1016/j.jedc.2023.104652">(Qian, 2023)</a>.</p>

<p>Households do not form inflation expectations uniformly. These expectations are biased upward, dispersed across individuals according to demographic characteristics, and volatile over time (<a href="https://doi.org/10.1016/B978-0-12-822927-9.00012-4">D’Acunto et al. (2023)</a>; <a href="https://doi.org/10.1093/jjfinec/nbae034">Doh et al. (2025)</a>). In particular, low-income and less-educated individuals exhibit larger biases in their inflation expectations <a href="https://doi.org/10.1016/j.ecosys.2021.100878">(Reid et al., 2021)</a>. Although these biases are typically defined relative to the national average, <a href="https://doi.org/10.1016/j.jmoneco.2017.08.002">Kaplan and Schulhofer-Wohl (2017)</a> show that lower-income U.S. households indeed experience higher inflation in their consumption bundles.</p>

<p>The preceding evidence motivates the question of how uncertainty influences inflation expectations. I distinguish two potential dimensions of this impact. The first concerns the dispersion, or cross-sectional distribution, of inflation expectations. When uncertainty increases, households may receive noisier signals about the evolution of the price level, as the variance of variables in their information set rises, leading to a wider distribution of expectations. Moreover, because collecting and processing information becomes more costly during periods of heightened uncertainty, the influence of individual signals may become more pronounced.</p>

<p>There is empirical evidence on the effect of EPU on inflation uncertainty. <a href="https://doi.org/10.1016/j.jmoneco.2017.06.001">Binder (2017)</a> measures inflation uncertainty using the proportion of round-number responses in surveys eliciting household inflation expectations. The author shows that EPU is more strongly correlated with short-run inflation uncertainty than with long-run inflation uncertainty. By contrast, the relationship is reversed for monetary policy uncertainty (MPU). The explanation for this latter case is likely related to the role of central banks in anchoring inflation expectations to specific targets. When examining differences across demographic groups, the impact of EPU is stronger for higher-income and more-educated individuals. This finding is consistent with their higher levels of financial literacy <a href="https://www.nber.org/papers/w14084">(Lusardi, 2008)</a> and greater attentiveness to political news <a href="https://news.gallup.com/poll/513128/attention-political-news-slips-back-typical-levels.aspx">(Jones, 2023)</a>.</p>

<p>Beyond dispersion, uncertainty may also affect inflation expectations at the aggregate level. This second dimension concerns the impact of uncertainty on the average level of inflation expectations. What might be the expected sign of this effect? One intuition rests on how households categorize both inflation and uncertainty as “good” or “bad” outcomes. Inflation may be perceived as unfavorable due to its erosion of purchasing power, while uncertainty may be viewed negatively because of the potential instability it implies for households’ labor income and financial positions. If both are labeled as adverse outcomes, an increase in uncertainty could raise inflation expectations. This mechanism can be associated with a cognitive bias known as the horn effect (or negative halo), whereby a negative assessment of one attribute of the economy leads agents to infer negative outcomes in other macroeconomic variables, even in the absence of a causal link <a href="https://www.taylorfrancis.com/chapters/edit/10.4324/9781315696935-19/halo-effects-joseph-forgas-simon-laham">(Forgas and Laham, 2016)</a>. Consistent with this intuition, individuals tend to fear inflation more than deflation <a href="https://www.jstor.org/stable/2534666">(DeLong and Sims, 1999)</a>.</p>

<p>This intuition, however, need not apply in all circumstances. If a specific situation generating higher uncertainty is associated with deflationary pressures, the implications for inflation expectations may differ. This was the case during the Great Depression, when a one-standard-deviation increase in uncertainty was shown to reduce GDP and the price level <a href="https://link.springer.com/article/10.1007/s11698-019-00190-1">(Mathy, 2020)</a>. In this vein, <a href="https://doi.org/10.1016/j.jmoneco.2016.07.002">Leduc and Liu (2016)</a> argue that uncertainty shocks resemble aggregate demand shocks, increasing unemployment and lowering inflation.</p>

<p>These mechanisms may not operate uniformly across the population. When considering potential differences across demographic groups, individuals with lower financial literacy are likely more prone to form forecasts based on a horn effect. This interpretation is consistent with evidence showing that individuals pay attention to news reports, such as professional forecasts, only occasionally, leading to stickiness in aggregate expectations <a href="https://doi.org/10.1162/00335530360535207">(Carroll, 2003)</a>.</p>

<p>Another behavioral channel through which uncertainty may affect inflation expectations is loss aversion. As noted earlier, inflation expectations are upward biased. From an econometric perspective, such expectations would be deemed irrational if agents are assumed to have symmetric loss functions. However, when loss functions are asymmetric, rationality can be restored. In particular, when individuals are averse to “bad” outcomes, such as higher-than-expected inflation, they incorporate this loss aversion into their forecasts <a href="https://doi.org/10.1162/JEEA.2008.6.1.122">(Elliott et al., 2008)</a>. Consequently, when uncertainty increases, loss aversion may become more pronounced, leading agents to bias their inflation predictions upward.</p>

<p>In addition to these direct behavioral channels, uncertainty may influence inflation expectations through indirect macroeconomic mechanisms. Because inflation expectations depend in part on past realized inflation, the effect of uncertainty may operate through inflation itself. For instance, if uncertainty acts as a negative demand shock and inflation declines, households’ inflation expectations may also decrease, albeit with a delay.</p>

<p>In conclusion, analyzing the relationship between uncertainty and households’ expectations about macroeconomic outcomes is an important topic for further research. In particular, it would be novel to understand potential discrepancies in both magnitude and direction when comparing expectations with realized outcomes. While uncertainty clearly affects inflation, less is known about its influence on forecast revisions of inflation. Are such revisions driven by cognitive biases, such as the horn effect? Is there an overreaction rooted in loss aversion? Are these effects heterogeneous across population segments? What role do information acquisition and processing costs play in shaping this relationship? Addressing these questions could significantly improve our understanding of the implications for monetary policy, especially in an environment where elevated uncertainty has become a persistent feature of modern economies.</p>

<h2 id="references">References</h2>

<div class="blog-references">

<p>
Baker, S. R., Bloom, N., &amp; Davis, S. J. (2016).
<a href="https://doi.org/10.1093/qje/qjw024">
Measuring economic policy uncertainty.
</a>
<em>The Quarterly Journal of Economics, 131</em>(4), 1593–1636.
</p>

<p>
Binder, C. C. (2017).
<a href="https://doi.org/10.1016/j.jmoneco.2017.06.001">
Measuring uncertainty based on rounding: New method and application to inflation expectations.
</a>
<em>Journal of Monetary Economics, 90</em>, 1–12.
</p>

<p>
Bruine de Bruin, W., Vanderklaauw, W., Downs, J. S., Fischhoff, B., Topa, G., &amp; Armantier, O. (2010).
<a href="https://doi.org/10.1111/j.1745-6606.2010.01174.x">
Expectations of inflation: The role of demographic variables, expectation formation, and financial literacy.
</a>
<em>Journal of Consumer Affairs, 44</em>(2), 381–402.
</p>

<p>
Caldara, D., Fuentes-Albero, C., Gilchrist, S., &amp; Zakrajšek, E. (2016).
<a href="https://doi.org/10.1016/j.euroecorev.2016.02.020">
The macroeconomic impact of financial and uncertainty shocks.
</a>
<em>European Economic Review, 88</em>, 185–207.
</p>

<p>
Carroll, C. D. (2003).
<a href="https://doi.org/10.1162/00335530360535207">
Macroeconomic expectations of households and professional forecasters.
</a>
<em>The Quarterly Journal of Economics, 118</em>(1), 269–298.
</p>

<p>
Coibion, O., Gorodnichenko, Y., &amp; Weber, M. (2022).
<a href="https://doi.org/10.1086/718982">
Monetary policy communications and their effects on household inflation expectations.
</a>
<em>Journal of Political Economy, 130</em>(6), 1537–1584.
</p>

<p>
D'Acunto, F., Malmendier, U., &amp; Weber, M. (2023).
<a href="https://doi.org/10.1016/B978-0-12-822927-9.00012-4">
What do the data tell us about inflation expectations?
</a>
In <em>Handbook of Economic Expectations</em>, 133–161.
</p>

<p>
DeLong, J. B., &amp; Sims, C. A. (1999).
<a href="https://www.jstor.org/stable/2534666">
Should we fear deflation?
</a>
<em>Brookings Papers on Economic Activity, 1999</em>(1), 225–252.
</p>

<p>
Doh, T., Lee, J. H., &amp; Park, W. Y. (2025).
<a href="https://doi.org/10.1093/jjfinec/nbae034">
Heterogeneity in household inflation expectations and monetary policy.
</a>
<em>Journal of Financial Econometrics, 23</em>(1), nbae034.
</p>

<p>
Elliott, G., Komunjer, I., &amp; Timmermann, A. (2008).
<a href="https://doi.org/10.1162/JEEA.2008.6.1.122">
Biases in macroeconomic forecasts: Irrationality or asymmetric loss?
</a>
<em>Journal of the European Economic Association, 6</em>(1), 122–157.
</p>

<p>
Forgas, J. P., &amp; Laham, S. M. (2016).
<a href="https://www.taylorfrancis.com/chapters/edit/10.4324/9781315696935-19/halo-effects-joseph-forgas-simon-laham">
Halo effects.
</a>
In <em>Cognitive Illusions</em>, 276–290.
</p>

<p>
Jones, J. M. (2023).
<a href="https://news.gallup.com/poll/513128/attention-political-news-slips-back-typical-levels.aspx">
U.S. attention to political news slips back to typical levels.
</a>
<em>Gallup</em>.
</p>

<p>
Kaplan, G., &amp; Schulhofer-Wohl, S. (2017).
<a href="https://doi.org/10.1016/j.jmoneco.2017.08.002">
Inflation at the household level.
</a>
<em>Journal of Monetary Economics, 91</em>, 19–38.
</p>

<p>
Leduc, S., &amp; Liu, Z. (2016).
<a href="https://doi.org/10.1016/j.jmoneco.2016.07.002">
Uncertainty shocks are aggregate demand shocks.
</a>
<em>Journal of Monetary Economics, 82</em>, 20–35.
</p>

<p>
Jurado, K., Ludvigson, S. C., &amp; Ng, S. (2015).
<a href="https://www.aeaweb.org/articles?id=10.1257/aer.20131193">
Measuring uncertainty.
</a>
<em>American Economic Review, 105</em>(3), 1177–1216.
</p>

<p>
Lusardi, A. (2008).
<a href="https://www.nber.org/papers/w14084">
Household saving behavior: The role of financial literacy, information, and financial education programs.
</a>
<em>National Bureau of Economic Research Working Paper</em>.
</p>

<p>
Mathy, G. P. (2020).
<a href="https://link.springer.com/article/10.1007/s11698-019-00190-1">
How much did uncertainty shocks matter in the Great Depression?
</a>
<em>Cliometrica, 14</em>(2), 283–323.
</p>

<p>
Qian, W. (2023).
<a href="https://doi.org/10.1016/j.jedc.2023.104652">
House price expectations and household consumption.
</a>
<em>Journal of Economic Dynamics and Control, 151</em>, 104652.
</p>

<p>
Reid, M., Siklos, P., &amp; Du Plessis, S. (2021).
<a href="https://doi.org/10.1016/j.ecosys.2021.100878">
What drives household inflation expectations in South Africa? Demographics and anchoring under inflation targeting.
</a>
<em>Economic Systems, 45</em>(3), 100878.
</p>

</div>]]></content><author><name>Carlos Delgado</name><email>cadelgado@tamu.edu</email></author><category term="uncertainty" /><category term="inflation expectations" /><category term="household expectations" /><category term="behavioral macroeconomics" /><category term="monetary policy" /><summary type="html"><![CDATA[]]></summary></entry><entry><title type="html">Does (and how does) financial literacy shape monetary policy transmission?</title><link href="https://cadelgadof.github.io/posts/2025/12/financial-literacy-monetary-policy-transmission/" rel="alternate" type="text/html" title="Does (and how does) financial literacy shape monetary policy transmission?" /><published>2025-12-30T00:00:00+00:00</published><updated>2025-12-30T00:00:00+00:00</updated><id>https://cadelgadof.github.io/posts/2025/12/financial-literacy-monetary-policy-transmission</id><content type="html" xml:base="https://cadelgadof.github.io/posts/2025/12/financial-literacy-monetary-policy-transmission/"><![CDATA[<!--more-->

<p>Central banks not only stabilize inflation by setting nominal interest rates, but also by communicating their policies effectively to anchor individuals’ expectations. However, although policymakers convey their decisions to agents, not all individuals receive or process this information in a complete and rational way. Effective transmission requires that individuals possess a basic understanding of financial concepts, particularly inflation, interest rates, and the functioning of investment and debt instruments. In other words, this relates to the concept of financial literacy.</p>

<p>What is financial literacy? It is the degree of knowledge of four essential concepts in financial decision-making: (1) knowledge of interest rates (numeracy), (2) interest compounding, (3) inflation, and (4) risk diversification. The S&amp;P Global FinLit Survey elicits these aspects from a representative sample of individuals across countries. A person is defined as financially literate when he or she correctly answers at least three out of the four financial concepts described above <a href="https://gflec.org/wp-content/uploads/2015/11/Finlit_paper_16_F2_singles.pdf">(Klapper et al., 2015)</a>.</p>

<p>Promoting financial literacy among households is relevant for increasing attention to and monitoring of key economic variables such as interest rates, unemployment, and inflation. This knowledge allows households to make more informed consumption, debt, and investment decisions. Importantly, financial education also has macroeconomic implications, particularly for the transmission of monetary policy. <a href="https://doi.org/10.1016/j.jimonfin.2024.103066">Niţoi and Pochea (2024)</a> find that financially literate individuals are more likely to trust central banks, while <a href="https://doi.org/10.1086/718982">Coibion et al. (2022)</a> emphasize the role of cognitive ability in shaping how individuals process monetary policy signals.</p>

<p>These findings suggest that improving numeracy and financial knowledge may enhance expectation formation and contribute to more effective monetary policy transmission. Unfortunately, there is evidence of persistent gaps in this area. <a href="https://doi.org/10.1017/flw.2023.13">Lusardi and Streeter (2023)</a> show that mastery of fundamental financial concepts remains low in the United States, particularly among younger individuals, those with lower levels of education, women, and the non-employed.</p>

<p>Standard DSGE models assume that agents are fully financially literate and attentive, and therefore make optimal decisions subject to their budget constraints. This assumption is counterfactual, as in reality there are substantial gaps in financial literacy. Consequently, this opens important avenues for future research. For example, I am interested in understanding why the direct monetary policy channel of intertemporal substitution appears to be weaker than other indirect transmission mechanisms. This channel posits that households adjust the timing of consumption in response to changes in the real interest rate, which requires forming inflation expectations and tracking nominal interest rates.</p>

<p>Gaps in financial literacy may partly explain the weak impact of intertemporal substitution, although further research is needed to confirm this hypothesis. Less financially educated individuals may exhibit inertia in saving or borrowing decisions when interest rates change, even in the absence of credit constraints. In other words, financial literacy may accelerate monetary policy transmission by lowering individuals’ costs of processing information about central bank decisions, thereby increasing their attentiveness to interest rate fluctuations. As a result, households would be more likely to adjust their saving and borrowing decisions quickly.</p>

<p>I provide another example. Cash flow is one of the indirect transmission mechanisms of monetary policy. It posits that fluctuations in interest rates affect debt service payments and, consequently, the cash flow available to households, thereby inducing changes in consumption. One of the most important debt components in terms of volume is mortgages. When mortgages carry variable interest rates, changes in interest payments are immediate. By contrast, when mortgages are set at fixed interest rates, households can benefit from monetary policy easing primarily through refinancing. However, not all households refinance their mortgages even when doing so would be optimal. This phenomenon is known as inaction.</p>

<p><a href="https://doi.org/10.1111/ijcs.12646">Bialowolski et al. (2022)</a> present evidence that higher financial literacy scores are associated with a greater likelihood of mortgage refinancing. Moreover, even when households decide to refinance, this does not necessarily imply that the new contract terms are optimal. In this vein, <a href="https://doi.org/10.1287/mnsc.2015.2272">Agarwal et al. (2016)</a> find that 57% of borrowers refinance suboptimally: most choose an inappropriate interest rate, while a smaller proportion wait too long to refinance. The likelihood of making smaller mistakes is higher among financially sophisticated borrowers.</p>

<p>Financial literacy plays an important role in shaping inflation expectations <a href="https://doi.org/10.1016/j.bir.2025.09.002">(Pedersen and Pérez, 2025)</a>. For instance, lower financial literacy is associated with higher inflation expectations and, consequently, weaker anchoring of expectations <a href="https://doi.org/10.1111/j.1745-6606.2010.01174.x">(Bruine de Bruin, 2010)</a>. Moreover, economic literacy enables individuals to form more accurate inflation forecasts. This improvement operates through information selection and processing channels, whereby more literate individuals are better able to identify relevant information and use it effectively, resulting in lower forecast errors. Although demographic differences in inflation expectations exist, these differences are largely driven by heterogeneity in economic literacy <a href="https://doi.org/10.1111/jmcb.12144">(Burke and Manz, 2014)</a>.</p>

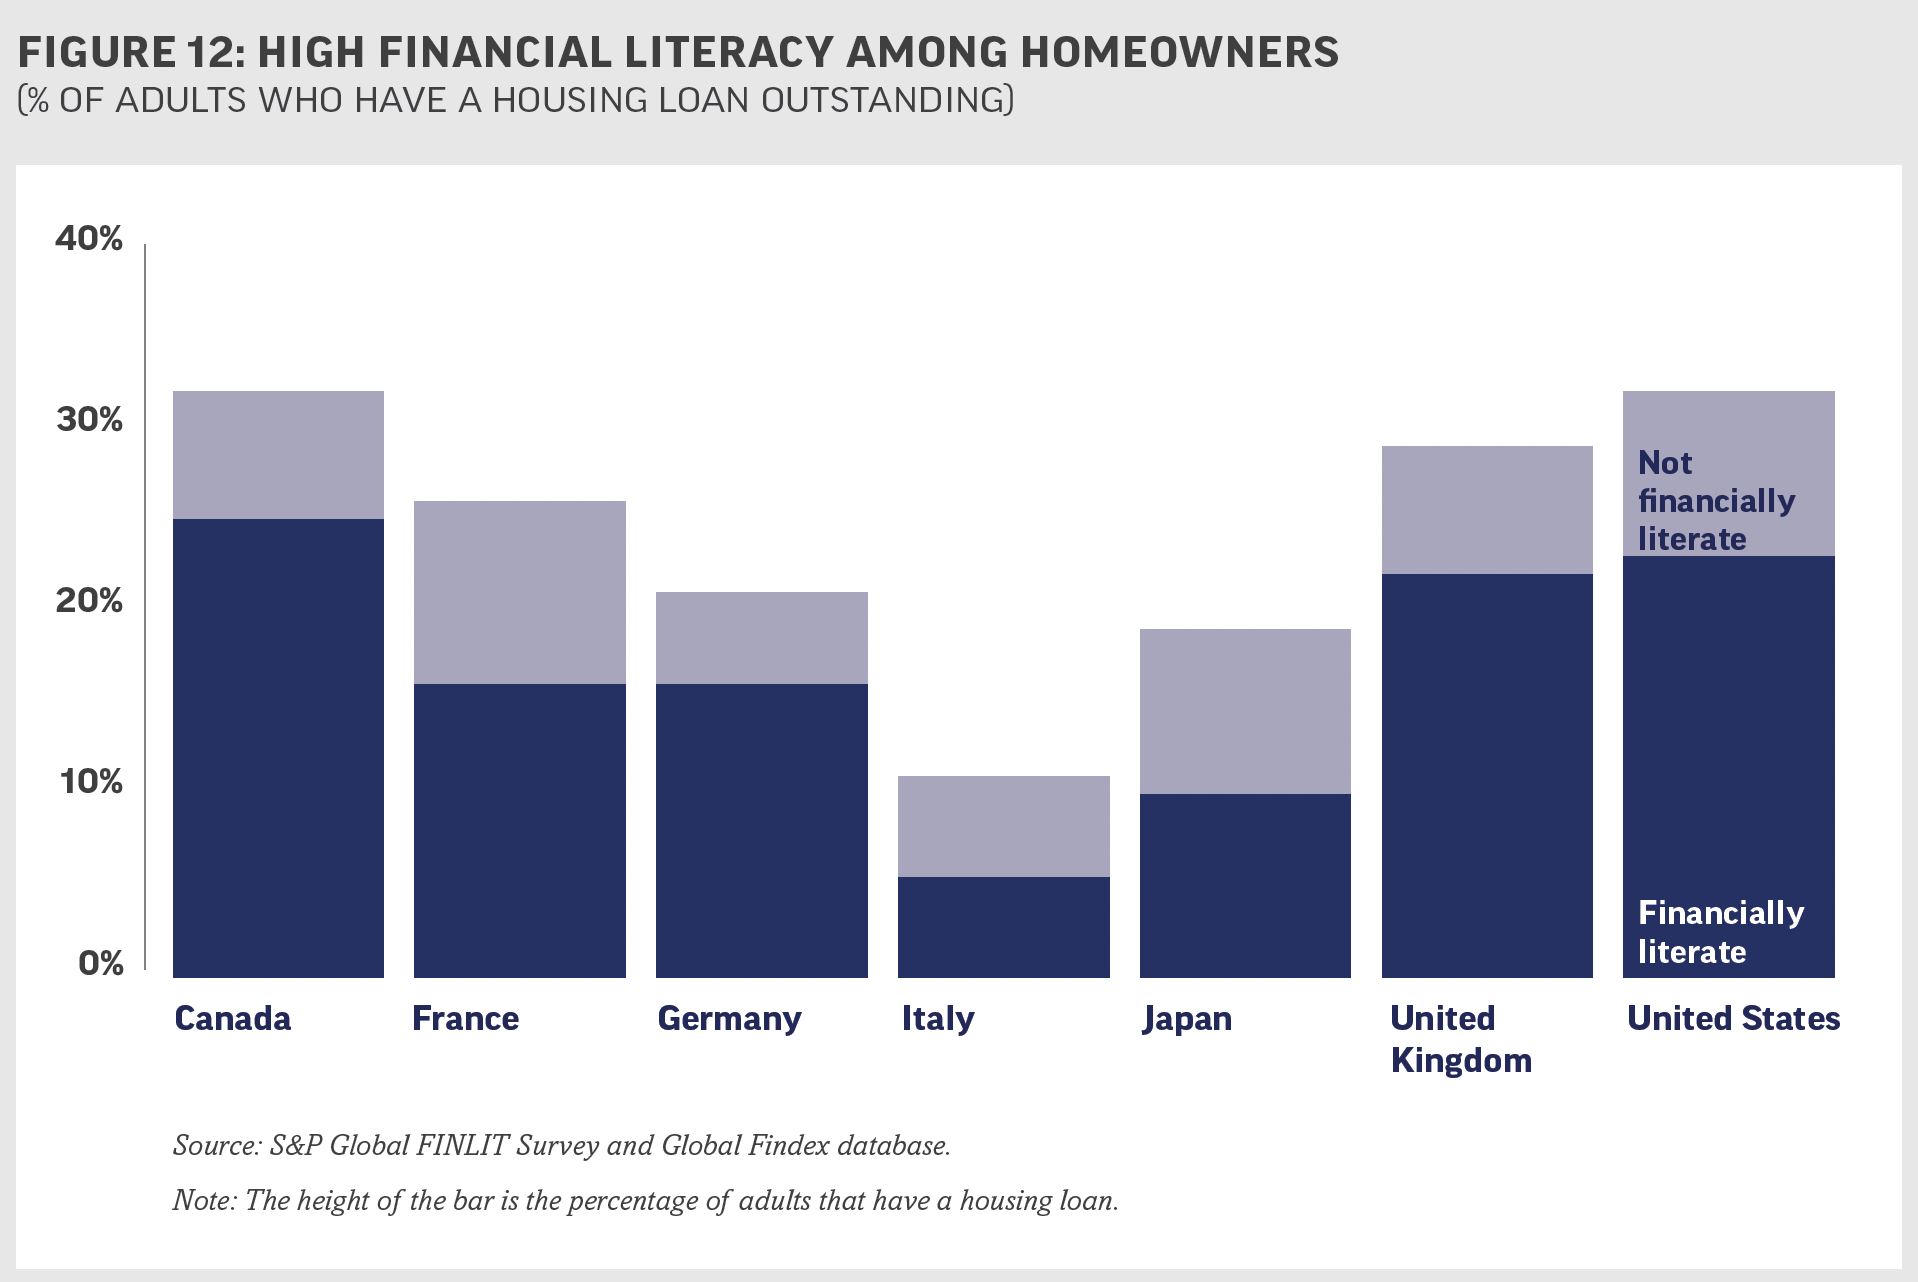
<p>It is important to emphasize that financial literacy is distinct from the concept of financial inclusion. The latter refers to individuals’ access to and use of affordable financial products. However, financial inclusion does not necessarily translate into higher financial literacy. For instance, approximately one third of U.S. homeowners are not financially literate (see the figure below), even though the majority have accessed mortgage financing.</p>

<p><img src="/images/fig12.png" alt="High financial literacy among homeowners" /></p>

<p><em>Figure 1. High financial literacy among homeowners. Source: S&amp;P Global FINLIT Survey and Global Findex database.</em></p>

<p>Although there has been significant progress in incorporating rational inattention (and related mechanisms) into macroeconomic models of policy transmission, financial literacy may constitute an additional piece of the puzzle for understanding the magnitude and speed of monetary policy effects. Accounting for financial literacy could help explain differences in policy transmission within a country over time, as well as cross-country differences among economies with varying levels of financial literacy.</p>

<h2 id="references">References</h2>

<div class="blog-references">

<p>
Agarwal, S., Rosen, R. J., &amp; Yao, V. (2016).
<a href="https://doi.org/10.1287/mnsc.2015.2272">
Why do borrowers make mortgage refinancing mistakes?
</a>
<em>Management Science, 62</em>(12), 3494–3509.
</p>

<p>
Bialowolski, P., Cwynar, A., Xiao, J. J., &amp; Weziak-Bialowolska, D. (2022).
<a href="https://doi.org/10.1111/ijcs.12646">
Consumer financial literacy and the efficiency of mortgage-related decisions: New evidence from the Panel Study of Income Dynamics.
</a>
<em>International Journal of Consumer Studies, 46</em>(1), 88–101.
</p>

<p>
Bruine de Bruin, W., Vanderklaauw, W., Downs, J. S., Fischhoff, B., Topa, G., &amp; Armantier, O. (2010).
<a href="https://doi.org/10.1111/j.1745-6606.2010.01174.x">
Expectations of inflation: The role of demographic variables, expectation formation, and financial literacy.
</a>
<em>Journal of Consumer Affairs, 44</em>(2), 381–402.
</p>

<p>
Burke, M. A., &amp; Manz, M. (2014).
<a href="https://doi.org/10.1111/jmcb.12144">
Economic literacy and inflation expectations: Evidence from a laboratory experiment.
</a>
<em>Journal of Money, Credit and Banking, 46</em>(7), 1421–1456.
</p>

<p>
Coibion, O., Gorodnichenko, Y., &amp; Weber, M. (2022).
<a href="https://doi.org/10.1086/718982">
Monetary policy communications and their effects on household inflation expectations.
</a>
<em>Journal of Political Economy, 130</em>(6), 1537–1584.
</p>

<p>
Klapper, L., Lusardi, A., &amp; van Oudheusden, P. (2015).
<a href="https://gflec.org/wp-content/uploads/2015/11/Finlit_paper_16_F2_singles.pdf">
Financial literacy around the world: Insights from the Standard &amp; Poor’s Ratings Services global financial literacy survey.
</a>
World Bank.
</p>

<p>
Lusardi, A., &amp; Streeter, J. L. (2023).
<a href="https://doi.org/10.1017/flw.2023.13">
Financial literacy and financial well-being: Evidence from the US.
</a>
<em>Journal of Financial Literacy and Wellbeing, 1</em>(2), 169–198.
</p>

<p>
Niţoi, M., &amp; Pochea, M. M. (2024).
<a href="https://doi.org/10.1016/j.jimonfin.2024.103066">
Trust in the central bank, financial literacy, and personal beliefs.
</a>
<em>Journal of International Money and Finance, 143</em>, 103066.
</p>

<p>
Pedersen, M., &amp; Pérez, K. (2025).
<a href="https://doi.org/10.1016/j.bir.2025.09.002">
Financial literacy and the impact of central bank communication on consumer inflation expectations.
</a>
<em>Borsa Istanbul Review</em>.
</p>

</div>]]></content><author><name>Carlos Delgado</name><email>cadelgado@tamu.edu</email></author><category term="monetary policy" /><category term="financial literacy" /><category term="household finance" /><category term="inflation expectations" /><category term="monetary policy transmission" /><summary type="html"><![CDATA[]]></summary></entry><entry><title type="html">Households’ attention to inflation: What do we know and what do we need to know?</title><link href="https://cadelgadof.github.io/posts/2025/11/households-attention-inflation/" rel="alternate" type="text/html" title="Households’ attention to inflation: What do we know and what do we need to know?" /><published>2025-11-29T00:00:00+00:00</published><updated>2025-11-29T00:00:00+00:00</updated><id>https://cadelgadof.github.io/posts/2025/11/households-attention-inflation</id><content type="html" xml:base="https://cadelgadof.github.io/posts/2025/11/households-attention-inflation/"><![CDATA[<!--more-->

<p>The Covid-19 pandemic triggered an inflation surge in nearly every country around the world. As a result, inflation has become a central topic of research among academics and policymakers, especially central banks. One crucial concern for central banks is ensuring that the population understands—and stays informed about—their policy decisions, particularly those related to inflation stabilization.</p>

<p>Standard New Keynesian DSGE models typically feature either a representative household or a heterogeneous set of households that maximize lifetime utility subject to a budget constraint. A key component of this constraint is asset accumulation, which depends on the real interest rate, defined as the nominal interest rate minus expected inflation. Consequently, expected inflation is the variable that households must forecast in order to solve their optimization problem.</p>

<p>In this framework, the models rely on the assumption of Full-Information Rational Expectations (FIRE), meaning that all households and firms form expectations about economic variables—such as inflation, GDP, and unemployment—using all available information, including news, data releases, and other signals, much like macroeconomists typically do.</p>

<p>However, real-world evidence suggests that this assumption does not hold. A key reason is that individuals face information-processing constraints: even if all relevant information is technically available, people cannot absorb or use everything. Instead, they prioritize some pieces of information over others when forming expectations about their future financial situation. Economic theory refers to this phenomenon as rational inattention <a href="https://doi.org/10.1016/S0304-3932(03)00029-1">(Sims, 2003)</a>; <a href="https://www.aeaweb.org/articles?id=10.1257/jel.20211524">(Maćkowiak, 2023)</a>.</p>

<p>The literature has proposed several ways to measure attention to inflation. One approach uses an equation similar to a Kalman filter, where attention is defined as the extent to which agents incorporate past forecast errors to improve their expectations. More specifically, the equation for attention builds on the contributions of <a href="https://www.aeaweb.org/conference/2025/program/paper/d8zS4sed">Pfäuti (2023)</a> and <a href="https://doi.org/10.1111/jmcb.13145">Pfäuti (2025)</a>, as shown below:</p>

\[\pi_{t+1|t}^{e}
=
\beta_0
+
\beta_1 \pi_{t|t-1}^{e}
+
\beta_2\left(\pi_t-\pi_{t|t-1}^{e}\right)
+
\epsilon_t\]

<p>In this case, the individual forms her expectation of future inflation (left-hand side) based on both her past forecast (the second term on the right-hand side), captured by the parameter $\beta_1$ as an autoregressive component, and on the previous prediction error, defined as the difference between actual inflation and the forecast in period $t$. The attention parameter is defined as</p>

\[\gamma=\frac{\beta_2}{\beta_1}\]

<p>which represents the relative weight the agent places on the forecast error when updating her expectations. This parameter $\gamma$ lies between 0 and 1, where a value of 1 indicates full attention, while a value of 0 corresponds to complete inattention—that is, the individual does not incorporate actual inflation when revising her expectations.</p>

<p>Another way to measure inattention is the approach of <a href="https://doi.org/10.1093/restud/rdae063">Bracha and Tang (2025)</a>, who propose using the discrepancies between individuals’ nowcasts of inflation and actual inflation. Another methodology relies on the proportion of individuals who provide mutually consistent inflation forecasts <a href="https://doi.org/10.26509/frbc-ec-202214">(Braitsch and Mitchell, 2022)</a>. This means that, after eliciting a point forecast, the interval of the density forecast that contains the point prediction must be assigned a positive probability. I explained these two types of forecasts in more detail in a previous blog post <a href="https://www.linkedin.com/pulse/household-inflation-expectations-from-brain-data-delgado-fuentealba-lztvc/">(Delgado, 2025)</a>.</p>

<p>There is also evidence that attention levels to inflation are not homogeneous across households. Studies show that attention increases with income <a href="https://hdl.handle.net/10419/315192">(Shabalina and Tzaawa-Krenzler, 2025)</a>, and that there is an inverse U-shaped relationship with age (the life cycle): individuals who participate in the labor force and save for retirement tend to display the highest levels of attention <a href="https://sites.duke.edu/econhonors/files/2021/11/Schultz2021.pdf">(Schultz, 2021)</a>. Additionally, there is evidence that housing tenure status matters. For the United States, homeowners appear to have higher levels of attention than renters <a href="https://doi.org/10.3386/w33595">(Piccolo and Gorodnichenko, 2025)</a>. One explanation is that individuals often acquire housing as a way to protect their wealth from being eroded by inflation <a href="https://doi.org/10.1111/jofi.13332">(Malmendier and Wellsjo, 2024)</a>.</p>

<p>At the same time, attention to inflation is time-varying. <a href="https://www.aeaweb.org/conference/2025/program/paper/d8zS4sed">Pfäuti (2023)</a> shows that attention increases when inflation volatility is higher. Additionally, the author tests for the existence of an inflation threshold at which individuals experience a discrete jump in attention once price changes exceed a certain level. He finds a threshold of 4% for the United States. These results are consistent with <a href="https://doi.org/10.1162/rest_a_01402">Korenok et al. (2026)</a>, who find a threshold between 2% and 4% for most countries. <a href="https://doi.org/10.3982/ECTA22764">Weber et al. (2025)</a> highlight the endogenous nature of inattention, showing that it responds to the surrounding economic environment—particularly the level of inflation.</p>

<p>I am particularly curious about whether, given the cross-sectional heterogeneity in attention driven by demographic characteristics, all households share the same threshold, or whether only some groups exhibit threshold behavior while others pay attention regardless of the regime. It is plausible, for example, that low-income households respond to a threshold, while individuals facing more complex financial decisions do not. In any case, this remains an open question.</p>

<p>Although we can analyze attention to inflation across different demographic groups, I believe it is equally important to understand the motivations behind paying attention to inflation. From an economic perspective, paying more attention involves both benefits and costs. The benefits stem from the need to make accurate inflation forecasts in order to make better financial decisions. For example, many payments—such as mortgage installments—are indexed to inflation. Likewise, monitoring inflation helps individuals make better saving decisions over time, both in terms of amounts and portfolio allocation.</p>

<p>On the other hand, the cost of paying attention to inflation arises from the effort required to process information, which involves time and cognitive resources. Individuals with higher levels of education—especially financial education—tend to face relatively lower attention costs. Similarly, people with stronger balance sheet positions, in terms of both debt and financial assets, stand to benefit more from forming accurate inflation expectations. From the perspective of balance sheet position, renters typically hold lower levels of financial assets and liabilities compared to homeowners <a href="https://doi.org/10.1093/restud/rdy074">(Cloyne et al., 2020)</a>.</p>

<p>Using data from the UK Inflation Attitudes Survey, I find that renters have a low level of knowledge about the role of monetary policy and the concept of inflation (see Figure 1). This gap persists even after controlling for age and social class. It is also evident that knowledge increases when inflation surges. At the same time, outright homeowners prefer higher interest rates because this is more convenient for them: the returns on their financial assets increase (see Figure 2). These results provide insights into potential mechanisms that explain differences in attention levels based on balance-sheet positions.</p>

<p><img src="/images/set-int-rate.png" alt="Knowledge about the role of monetary policy by housing tenure" /></p>

<p><em>Figure 1.</em></p>

<p><img src="/images/mov-int-rate.png" alt="Personal convenience regarding movements in interest rates by housing tenure" /></p>

<p><em>Figure 2.</em></p>

<p>Finally, it could be interesting to analyze how cultural factors affect attention to inflation. For example, long-term versus short-term orientations, or individualism versus collectivism (potential peer effects), may play a role. Another relevant question is the impact of immigration on households’ attention to inflation.</p>

<p>The United States, Europe, and Latin America have all experienced a significant increase in migration. Many migrants come from countries with very high inflation—if not outright hyperinflation. Individuals from such environments may pay closer attention to changes in purchasing power even after moving to countries with historically stable inflation. This raises important questions regarding the implications for monetary policy, which merit further analysis.</p>

<h2 id="references">References</h2>

<div class="blog-references">

<p>
Bracha, A., &amp; Tang, J. (2025).
<a href="https://doi.org/10.1093/restud/rdae063">
Inflation levels and (in) attention.
</a>
<em>Review of Economic Studies, 92</em>(3), 1564–1594.
</p>

<p>
Braitsch, H., &amp; Mitchell, J. (2022).
<a href="https://doi.org/10.26509/frbc-ec-202214">
A new measure of consumers’ (in) attention to inflation.
</a>
<em>Federal Reserve Bank of Cleveland, Economic Commentary, 2022-14</em>.
</p>

<p>
Cloyne, J., Ferreira, C., &amp; Surico, P. (2020).
<a href="https://doi.org/10.1093/restud/rdy074">
Monetary policy when households have debt: new evidence on the transmission mechanism.
</a>
<em>The Review of Economic Studies, 87</em>(1), 102–129.
</p>

<p>
Delgado, C. (2025, August 24).
<a href="https://www.linkedin.com/pulse/household-inflation-expectations-from-brain-data-delgado-fuentealba-lztvc/">
Household inflation expectations: From the brain to the data.
</a>
<em>LinkedIn</em>.
</p>

<p>
Korenok, O., Munro, D., &amp; Chen, J. (2026).
<a href="https://doi.org/10.1162/rest_a_01402">
Inflation and attention thresholds.
</a>
<em>Review of Economics and Statistics</em>, 1–28.
</p>

<p>
Maćkowiak, B., Matějka, F., &amp; Wiederholt, M. (2023).
<a href="https://www.aeaweb.org/articles?id=10.1257/jel.20211524">
Rational inattention: A review.
</a>
<em>Journal of Economic Literature, 61</em>(1), 226–273.
</p>

<p>
Malmendier, U., &amp; Wellsjo, A. S. (2024).
<a href="https://doi.org/10.1111/jofi.13332">
Rent or buy? inflation experiences and homeownership within and across countries.
</a>
<em>The Journal of Finance, 79</em>(3), 1977–2023.
</p>

<p>
Pfäuti, O. (2023).
<a href="https://www.aeaweb.org/conference/2025/program/paper/d8zS4sed">
The inflation attention threshold and inflation surges.
</a>
<em>arXiv preprint arXiv:2308.09480</em>.
</p>

<p>
Pfäuti, O. (2025).
<a href="https://doi.org/10.1111/jmcb.13145">
Inflation—who cares? Monetary policy in times of low attention.
</a>
<em>Journal of Money, Credit and Banking, 57</em>(5), 1211–1239.
</p>

<p>
Piccolo, J., &amp; Gorodnichenko, Y. (2025).
<a href="https://doi.org/10.3386/w33595">
Homeownership and Attention to Inflation: Evidence from Information Treatments.
</a>
<em>NBER Working Paper No. 33595</em>.
</p>

<p>
Schultz, J. L. (2021).
<a href="https://sites.duke.edu/econhonors/files/2021/11/Schultz2021.pdf">
Inflation Expectations over the Life Cycle under Rational Inattention.
</a>
Doctoral dissertation, Duke University Durham.
</p>

<p>
Shabalina, E., &amp; Tzaawa-Krenzler, M. (2025).
<a href="https://hdl.handle.net/10419/315192">
Heterogeneous attention to inflation and monetary policy.
</a>
<em>IMFS Working Paper Series, No. 219</em>.
</p>

<p>
Sims, C. A. (2003).
<a href="https://doi.org/10.1016/S0304-3932(03)00029-1">
Implications of rational inattention.
</a>
<em>Journal of Monetary Economics, 50</em>(3), 665–690.
</p>

<p>
Weber, M., Candia, B., Afrouzi, H., Ropele, T., Lluberas, R., Frache, S., ... &amp; Ponce, J. (2025).
<a href="https://doi.org/10.3982/ECTA22764">
Tell Me Something I Don't Already Know: Learning in Low- and High-Inflation Settings.
</a>
<em>Econometrica, 93</em>(1), 229–264.
</p>

</div>]]></content><author><name>Carlos Delgado</name><email>cadelgado@tamu.edu</email></author><category term="inflation" /><category term="inflation expectations" /><category term="attention" /><category term="rational inattention" /><category term="household finance" /><category term="monetary policy" /><summary type="html"><![CDATA[]]></summary></entry><entry><title type="html">From Central Banks to Households: The Journey of Monetary Policy</title><link href="https://cadelgadof.github.io/posts/2025/11/from-central-banks-to-households/" rel="alternate" type="text/html" title="From Central Banks to Households: The Journey of Monetary Policy" /><published>2025-11-02T00:00:00+00:00</published><updated>2025-11-02T00:00:00+00:00</updated><id>https://cadelgadof.github.io/posts/2025/11/from-central-banks-to-households</id><content type="html" xml:base="https://cadelgadof.github.io/posts/2025/11/from-central-banks-to-households/"><![CDATA[<!--more-->

<p>Central banks seek to stabilize inflation by influencing aggregate demand. Movements in interest rates can affect household consumption either directly or indirectly. In this blog, I refer to the process through which changes in interest rates eventually modify consumption as the travel of monetary policy — that is, the transmission process. The famous phrase “All roads lead to Rome” applies here, since monetary policy travels through different channels to affect consumption. The purpose of this blog is to present the main transmission mechanisms, along with empirical evidence and a discussion of potential gaps in the existing literature.</p>

<p>The direct channel of monetary policy transmission is intertemporal substitution. This refers to the extent to which households shift consumption from the present to the future when interest rates rise. In terms of modeling, it is captured by an elasticity <a href="https://doi.org/10.1086/261539">(Hall, 1988)</a>. There are different views in the literature regarding the value of the elasticity of intertemporal substitution (EIS). Empirical evidence based on subjective expectations suggests an elasticity between 0.5 and 0.7 <a href="https://doi.org/10.1016/j.jmoneco.2021.11.008">(Crump et al., 2022)</a>. At the same time, another strand of literature finds that wealthier households, stock market participants, and individuals with low risk aversion tend to have a higher EIS <a href="https://www.aeaweb.org/articles?id=10.1257/000282803321947399">(Vissing-Jørgensen and Attanasio, 2003)</a>. However, there is also evidence that the EIS is invariant across states of the economy—that is, between expansions and recessions—and across housing tenure categories <a href="https://ssrn.com/abstract=5465255">(Delgado, 2025)</a>.</p>

<p>There are also several indirect channels, through which interest rates affect other macroeconomic variables that, in turn, influence consumption. This represents a longer journey from interest rates to households. One example is the income channel: a reduction in interest rates stimulates aggregate demand, which increases households’ income. In response, households allocate a fraction of this additional income to consumption, according to their marginal propensity to consume (MPC).</p>

<p>Another indirect mechanism is the cash-flow, or interest rate exposure, channel, through which payments linked to interest rate changes are affected. For example, if a household is repaying a mortgage, an expansionary monetary policy reduces the outflow of cash from these repayments when the mortgage has an adjustable rate. If the mortgage instead has a fixed rate, monetary easing can increase the incentive to refinance the debt. A third indirect mechanism is the wealth channel, where changes in inflation generated by monetary policy alter the real value of both assets and liabilities. This is also known as the Fisher channel. For instance, if inflation rises after a reduction in interest rates, wealth is redistributed from lenders to borrowers, since the real value of nominal debt decreases. When the effects of these two channels interact—redistributing resources across households with different marginal propensities to consume (MPCs)—there is an additional impact on aggregate consumption. This is referred to as the redistribution channel <a href="https://www.aeaweb.org/articles?id=10.1257/aer.20160137">(Auclert, 2019)</a>.</p>

<p>Finally, the liquidity constraints channel posits that households respond differently in their consumption behavior depending on their holdings of financial assets and debt levels. When households are wealthy and possess substantial assets, they can use these as buffers to smooth consumption, making them less sensitive to changes in interest rates. In contrast, households facing liquidity constraints tend to exhibit hand-to-mouth behavior, meaning that an expansionary monetary policy gives them an incentive to take on more debt due to improved credit conditions, thereby enabling them to meet their consumption needs <a href="https://doi.org/10.1093/restud/rdy074">(Cloyne et al., 2020)</a>.</p>

<p>When comparing the magnitude of the effects across mechanisms, evidence shows that indirect channels account for about two-thirds of the total impact of monetary policy in Heterogeneous Agent New Keynesian (HANK) models. Consequently, only one-third of the total effect is explained by the direct intertemporal substitution channel <a href="https://www.aeaweb.org/articles?id=10.1257/aer.20160042">(Kaplan et al., 2018)</a>; <a href="https://doi.org/10.1111/jmcb.12761">(Alves et al., 2020)</a>.</p>

<p><a href="https://www.aeaweb.org/articles?id=10.1257/mac.20210277">Ampudia et al. (2024)</a> study how household financial choices—specifically participation in stock markets and portfolio rebalancing—shape the impact of monetary policy on consumption. The authors develop a structural discrete choice model that incorporates financial frictions in the form of entry and adjustment costs. By matching model-implied moments to data from four European countries (Spain, Italy, France, and Germany), they generate a distribution of marginal propensities to consume (MPCs) across income, age, and education levels. They also use empirical estimates of the exogenous responses of household income by quintile and of stock prices to an expansionary monetary policy shock, in order to analyze the income and return channels, as well as their distributional effects. The return channel operates when a reduction in interest rates increases stock returns through a lower discount factor applied to future dividends, which raises stock prices, and through improved investment opportunities. Stockholders may then allocate a portion of this marginal increase in wealth to consumption.</p>

<p>Their main finding is that the intensity of the consumption response to monetary policy is country-specific. The results indicate that the response in France is the smallest, whereas that in Italy is the largest. The authors conduct a counterfactual exercise in which they replace the parameters estimated for France with those of Italy. Italian households display a higher level of patience (higher discount factor, β), a lower risk aversion coefficient (γ), and a higher elasticity of intertemporal substitution (θ), regardless of education level. Figure 8 in their paper reports the change in the consumption response under this parameter substitution. The impact of monetary policy on consumption in France indeed increases with the Italian parameters; however, it remains below the original response observed for Italy. When the authors further add Italy’s exogenous responses of household income and stock prices—which represent the indirect channels—to the French parametrization, the response becomes larger and more persistent. This implies that a significant portion of the cross-country differences in the effects of monetary policy remains unexplained.</p>

<p><img src="/images/figure8.png" alt="Consumption response: parameters and exogenous processes" /></p>

<p><em>Figure 8. Consumption response: Parameters and Exogenous Processes.</em></p>

<p>Finally, when examining the relationship between household income and the impact of monetary policy, they find a negative relationship for Spain and Italy, while France and Germany exhibit a U-shaped pattern. The income channel tends to be stronger for low-income households, who have higher marginal propensities to consume (MPCs), whereas the return channel mainly stimulates consumption among high-income households, who are more likely to participate in stock markets.</p>

<p>As mentioned earlier, part of the cross-country differences in the impact of monetary policy among these four countries cannot be explained by variations in the parametrization process. Therefore, it would be interesting to explore whether similar patterns of results between Spain and Italy, and between Germany and France, also appear in other dimensions. One possible explanation involves cultural factors, which are associated with the set of social norms and values that shape behavior within a society. The Culture Factor Group is an organization that collects data on individuals’ attitudes across six dimensions: power distance, individualism, motivation toward achievement and success, long-term orientation, and indulgence <a href="https://www.theculturefactor.com/country-comparison-tool">(The Culture Factor Group, n.d.)</a>. The following set of graphs presents the levels of these factors for the four countries.</p>

<p><img src="/images/cultural-factor.png" alt="Cultural factors across France, Germany, Italy, and Spain" /></p>

<p>It is observed that both Germany and France exhibit relatively higher levels of individualism compared with Italy and the European average. My hypothesis is that more collectivist societies experience stronger spillover effects in the transmission of monetary policy, as closer social ties may enhance communication and information sharing. Consequently, monetary policy transmission could be stronger in these contexts. At the same time, less individualistic societies may display higher marginal propensities to consume (MPCs), as part of their consumption may involve caring for others within their social networks. These societies might also feature higher consumption floors, supported by government transfers and social safety nets.</p>

<p>Regarding long-term orientation, a similar pattern emerges, with Germany and France again exhibiting higher levels in this dimension. This cultural factor may be associated with a lower prevalence of hand-to-mouth (HtM) behavior among households. Such an explanation could account for why the effects of monetary policy are stronger in Spain and Italy, particularly among low-income households.</p>

<p>Institutional quality may also influence the intensity of the impact of monetary policy on households’ consumption. Evidence shows that institutional quality—encompassing aspects such as law and order, government stability, and the investment profile—is significantly related to the cyclicality of monetary policy. In other words, under high institutional quality, demand shocks generate a positive comovement between output and interest rates, whereas under low institutional quality, this comovement becomes negative <a href="https://doi.org/10.1016/j.jmacro.2013.11.004">(Duncan, 2014)</a>. Furthermore, in countries with weak institutional quality, medium-term growth risks tend to rise following contractionary monetary policy shocks, while these risks remain relatively stable in countries with strong institutional frameworks <a href="https://papers.ssrn.com/sol3/papers.cfm?abstract_id=4998074">(Emter et al., 2024)</a>.</p>

<p>I collect data from the World Bank and the International Monetary Fund (IMF) on institutional quality and financial market development, respectively, for the countries analyzed by <a href="https://www.aeaweb.org/articles?id=10.1257/mac.20210277">Ampudia et al. (2024)</a>, in order to identify patterns that could explain the nonlinear impact of monetary policy. The data are presented in the table below.</p>

<p><img src="/images/institutional-quality.png" alt="Institutional quality and financial market development" /></p>

<p>In Panel A, the values of institutional quality are higher for Germany and France, which are the countries that exhibit a lower impact of monetary policy. Following the evidence presented by <a href="https://papers.ssrn.com/sol3/papers.cfm?abstract_id=4998074">Emter et al. (2024)</a>, high institutional quality may smooth the transmission of monetary policy, thereby enhancing economic resilience. In addition, Panel B shows that Spain has the most developed financial markets, particularly in terms of access, efficiency, and depth. According to the findings of <a href="https://www.aeaweb.org/articles?id=10.1257/mac.20210277">Ampudia et al. (2024)</a>, Spain exhibits the strongest and fastest response in the return channel. Consequently, the high level of stock market development may help explain this result.</p>

<p>In conclusion, there are still many challenges in uncovering new routes in the travel of monetary policy from central banks to households. The current research trend points toward understanding its heterogeneous and distributional effects. I believe that behavioral channels represent an important avenue for further exploration. For instance, not all households pay the same level of attention to inflation or changes in interest rates. Moreover, greater efforts could be devoted to modeling and testing the impact of cultural differences on monetary policy transmission.</p>

<h2 id="references">References</h2>

<div class="blog-references">

<p>
Alves, F., Kaplan, G., Moll, B., &amp; Violante, G. L. (2020).
<a href="https://doi.org/10.1111/jmcb.12761">
A further look at the propagation of monetary policy shocks in HANK.
</a>
<em>Journal of Money, Credit and Banking, 52</em>(S2), 521–559.
</p>

<p>
Ampudia, M., Cooper, R., Le Blanc, J., &amp; Zhu, G. (2024).
<a href="https://www.aeaweb.org/articles?id=10.1257/mac.20210277">
MPC heterogeneity and the dynamic response of consumption to monetary policy.
</a>
<em>American Economic Journal: Macroeconomics, 16</em>(3), 343–388.
</p>

<p>
Auclert, A. (2019).
<a href="https://www.aeaweb.org/articles?id=10.1257/aer.20160137">
Monetary policy and the redistribution channel.
</a>
<em>American Economic Review, 109</em>(6), 2333–2367.
</p>

<p>
Cloyne, J., Ferreira, C., &amp; Surico, P. (2020).
<a href="https://doi.org/10.1093/restud/rdy074">
Monetary policy when households have debt: new evidence on the transmission mechanism.
</a>
<em>The Review of Economic Studies, 87</em>(1), 102–129.
</p>

<p>
Crump, R. K., Eusepi, S., Tambalotti, A., &amp; Topa, G. (2022).
<a href="https://doi.org/10.1016/j.jmoneco.2021.11.008">
Subjective intertemporal substitution.
</a>
<em>Journal of Monetary Economics, 126</em>, 118–133.
</p>

<p>
Delgado, C. (2025).
<a href="https://ssrn.com/abstract=5465255">
Monetary Policy During Good and Bad Times: The Role of Household Debt and Liquidity.
</a>
Available at SSRN 5465255.
</p>

<p>
Duncan, R. (2014).
<a href="https://doi.org/10.1016/j.jmacro.2013.11.004">
Institutional quality, the cyclicality of monetary policy and macroeconomic volatility.
</a>
<em>Journal of Macroeconomics, 39</em>, 113–155.
</p>

<p>
Emter, L., Moura, A., Setzer, R., &amp; Zorell, N. (2024).
<a href="https://papers.ssrn.com/sol3/papers.cfm?abstract_id=4998074">
Monetary policy and growth-at-risk: the role of institutional quality.
</a>
<em>European Central Bank (ECB) Working Paper No. 2024/2989</em>.
</p>

<p>
Hall, R. E. (1988).
<a href="https://doi.org/10.1086/261539">
Intertemporal substitution in consumption.
</a>
<em>Journal of Political Economy, 96</em>(2), 339–357.
</p>

<p>
Kaplan, G., Moll, B., &amp; Violante, G. L. (2018).
<a href="https://www.aeaweb.org/articles?id=10.1257/aer.20160042">
Monetary policy according to HANK.
</a>
<em>American Economic Review, 108</em>(3), 697–743.
</p>

<p>
The Culture Factor Group. (n.d.).
<a href="https://www.theculturefactor.com/country-comparison-tool">
Country comparison tool.
</a>
Retrieved October 30, 2025.
</p>

<p>
Vissing-Jørgensen, A., &amp; Attanasio, O. P. (2003).
<a href="https://www.aeaweb.org/articles?id=10.1257/000282803321947399">
Stock-market participation, intertemporal substitution, and risk-aversion.
</a>
<em>American Economic Review, 93</em>(2), 383–391.
</p>

</div>]]></content><author><name>Carlos Delgado</name><email>cadelgado@tamu.edu</email></author><category term="monetary policy" /><category term="household consumption" /><category term="monetary policy transmission" /><category term="household finance" /><category term="heterogeneous agents" /><category term="behavioral macroeconomics" /><summary type="html"><![CDATA[]]></summary></entry><entry><title type="html">Hand-to-Mouth households: Who are they and why?</title><link href="https://cadelgadof.github.io/posts/2025/09/hand-to-mouth-households/" rel="alternate" type="text/html" title="Hand-to-Mouth households: Who are they and why?" /><published>2025-09-28T00:00:00+00:00</published><updated>2025-09-28T00:00:00+00:00</updated><id>https://cadelgadof.github.io/posts/2025/09/hand-to-mouth-households</id><content type="html" xml:base="https://cadelgadof.github.io/posts/2025/09/hand-to-mouth-households/"><![CDATA[<!--more-->

<p>Studying how households make consumption and saving decisions is crucial for analyzing the impacts of macroeconomic policies—such as monetary and fiscal policies—as well as their implications for aggregate welfare. Traditional consumption theory states that households adjust their expenditures in direct relation to disposable income: they increase consumption when facing unexpected income changes, in proportions defined by the marginal propensity to consume (MPC). For example, if disposable income rises by 1,000 and the MPC is 0.7, then consumption increases by 700, while the remaining 300 is allocated to saving. However, advances in macroeconomic research show that consumption decisions are more complex than this simple framework suggests.</p>

<p>Do all households save part of their disposable income? And do all households have full access to credit markets to smooth consumption without difficulties? The literature defines Hand-to-Mouth (HtM) individuals as those who allocate their current income entirely to consumption, meaning they neither save nor borrow. From another perspective, these households are also commonly known as rule-of-thumb consumers, who may set aside only a small, fixed proportion of their income for saving. In practice, their marginal propensity to consume (MPC) is equal to, or very close to, one. One of the main causes of HtM behavior is liquidity constraints: these households face limitations in accessing financial markets for borrowing. Moreover, they encounter high transaction costs in asset markets—not only monetary costs, but also costs in terms of financial knowledge and literacy.</p>

<p>An important factor influencing the proportion of households classified as Hand-to-Mouth (HtM) is financial inclusion. Evidence shows that individuals living in countries with high levels of financial access are less likely to be HtM. In contrast, higher unemployment rates and a larger informal sector are positively associated with HtM behavior. Moreover, a greater share of HtM households is typically found in economies with lower Human Development Index scores <a href="https://doi.org/10.1007/s40847-025-00425-2">(Tran, 2025)</a>.</p>

<p>From a comparative perspective, the share of HtM households also varies across developed countries. <a href="https://www.brookings.edu/articles/the-wealthy-hand-to-mouth/">Kaplan et al. (2014)</a> report about 30% in the United States, 20% in Australia and Spain, and more than 30% in the United Kingdom and Germany. In South Korea, the figure is around 35% <a href="https://doi.org/10.1080/1226508X.2017.1328681">(Park, 2017)</a>, whereas in Japan it is only 13% <a href="https://doi.org/10.1016/j.econlet.2016.01.014">(Hara et al., 2016)</a>. Similarly low proportions, close to 10%, are observed in Malta, Austria, and the Netherlands <a href="https://www.imf.org/en/Publications/WP/Issues/2024/03/22/What-Drives-Cross-Country-Differences-in-the-Share-of-Hand-to-Mouth-Households-546477">(Arroyo and Tisnés, 2024)</a>.</p>

<p>One might assume that only low-income households fall into the category of Hand-to-Mouth (HtM), since they lack the saving capacity to prioritize basic consumption. However, wealthy households can also belong to this category. <a href="https://www.brookings.edu/articles/the-wealthy-hand-to-mouth/">Kaplan et al. (2014)</a> report that more than two-thirds of American households classified as HtM are not technically poor. For instance, this may be the case for consumers who own a physical asset, such as a house, but face high financial leverage due to a mortgage. Such indebtedness limits their credit access and saving opportunities, thereby constraining their ability to smooth consumption over time.</p>

<p>The presence of Hand-to-Mouth (HtM) households is highly relevant because of its implications for fiscal and monetary policy. <a href="https://academic.oup.com/restud/article/87/1/102/5272505">Cloyne et al. (2020)</a> use housing tenure as a proxy for balance-sheet positions, identifying systematic patterns of consumption and saving behavior. Mortgagors, who are wealthy in the sense that they own physical assets, typically face liquidity constraints due to mortgage payments. By contrast, outright homeowners not only hold substantial physical assets but also significant financial assets. These households are able to smooth consumption over time, and empirical evidence shows no significant effects of monetary policy on their spending. Mortgagors, however, experience large increases in consumption following monetary easing. A third group, renters, generally lack both physical and financial assets. They are also affected by monetary policy, but to a lesser extent than mortgagors. This evidence aligns with the findings of Heterogeneous Agent New Keynesian (HANK) models, which emphasize that the main transmission mechanism of monetary policy operates through indirect effects—such as liquidity constraints—rather than the direct channel of intertemporal substitution <a href="https://www.aeaweb.org/articles?id=10.1257/aer.20160042">(Kaplan et al., 2018)</a>.</p>

<p>Similar patterns emerge in the case of fiscal policy. <a href="https://academic.oup.com/restud/article/84/1/45/2669979">Cloyne and Surico (2017)</a>, using UK data, show that only mortgagors significantly adjust their consumption following unexpected tax changes, while outright homeowners exhibit no response. This again underscores the central role of liquidity constraints.</p>

<p>Another important question that emerges is: once a household is Hand-to-Mouth (HtM), is it always HtM? Recent literature suggests that the nature of income changes plays a crucial role. <a href="https://www.aeaweb.org/articles?id=10.1257/aer.20181754">Baugh et al. (2021)</a> find that households facing liquidity constraints increase consumption when they receive expected tax refunds. However, the same individuals, in other periods, prefer to deposit these funds into liquid accounts to smooth consumption. Similarly, individuals with high liquidity levels tend to spend out of refunds, while others with high credit card debt use them to smooth repayment obligations.</p>

<p>These patterns cannot be fully explained by HtM behavior. Instead, they are consistent with mental accounting behavior: households categorize and treat money differently depending on its source and intended use, even though money is fungible <a href="https://doi.org/10.1287/mksc.4.3.199">(Thaler, 1985)</a>, <a href="https://doi.org/10.1002/%28SICI%291099-0771%28199909%2912%3A3%3C183%3A%3AAID-BDM318%3E3.0.CO%3B2-F">(1999)</a>.</p>

<p>Without a doubt, the study of HtM households and their macroeconomic implications remains a growing field. At the same time, advances in sophisticated methods—such as HANK models, which capture the dispersion in household behavior—have contributed to answering many of these questions.</p>

<h2 id="references">References</h2>

<div class="blog-references">

<p>
Arroyo, C., &amp; Tisnés, E. (2024).
<a href="https://www.imf.org/en/Publications/WP/Issues/2024/03/22/What-Drives-Cross-Country-Differences-in-the-Share-of-Hand-to-Mouth-Households-546477">
What Drives Cross-Country Differences in the Share of Hand-to-Mouth Households?
</a>
</p>

<p>
Baugh, B., Ben-David, I., Park, H., &amp; Parker, J. A. (2021).
<a href="https://www.aeaweb.org/articles?id=10.1257/aer.20181754">
Asymmetric consumption smoothing.
</a>
<em>American Economic Review, 111</em>(1), 192–230.
</p>

<p>
Cloyne, J., Ferreira, C., &amp; Surico, P. (2020).
<a href="https://academic.oup.com/restud/article/87/1/102/5272505">
Monetary policy when households have debt: new evidence on the transmission mechanism.
</a>
<em>The Review of Economic Studies, 87</em>(1), 102–129.
</p>

<p>
Cloyne, J. S., &amp; Surico, P. (2017).
<a href="https://academic.oup.com/restud/article/84/1/45/2669979">
Household debt and the dynamic effects of income tax changes.
</a>
<em>The Review of Economic Studies, 84</em>(1), 45–81.
</p>

<p>
Kaplan, G., Moll, B., &amp; Violante, G. L. (2018).
<a href="https://www.aeaweb.org/articles?id=10.1257/aer.20160042">
Monetary policy according to HANK.
</a>
<em>American Economic Review, 108</em>(3), 697–743.
</p>

<p>
Kaplan, G., Violante, G. L., &amp; Weidner, J. (2014).
<a href="https://www.brookings.edu/articles/the-wealthy-hand-to-mouth/">
The wealthy hand-to-mouth.
</a>
<em>Brookings Papers on Economic Activity, 2014</em>(1), 77–138.
</p>

<p>
Hara, R., Unayama, T., &amp; Weidner, J. (2016).
<a href="https://doi.org/10.1016/j.econlet.2016.01.014">
The wealthy hand to mouth in Japan.
</a>
<em>Economics Letters, 141</em>, 52–54.
</p>

<p>
Park, K. Y. (2017).
<a href="https://doi.org/10.1080/1226508X.2017.1328681">
The wealthy hand-to-mouth households in South Korea.
</a>
<em>Global Economic Review, 46</em>(3), 299–324.
</p>

<p>
Thaler, R. (1985).
<a href="https://doi.org/10.1287/mksc.4.3.199">
Mental accounting and consumer choice.
</a>
<em>Marketing Science, 4</em>(3), 199–214.
</p>

<p>
Thaler, R. H. (1999).
<a href="https://doi.org/10.1002/%28SICI%291099-0771%28199909%2912%3A3%3C183%3A%3AAID-BDM318%3E3.0.CO%3B2-F">
Mental accounting matters.
</a>
<em>Journal of Behavioral Decision Making, 12</em>(3), 183–206.
</p>

<p>
Tran, H. T. (2025).
<a href="https://doi.org/10.1007/s40847-025-00425-2">
Determinants of hand-to-mouth behavior in Asian developing countries: Does financial access matter?
</a>
<em>Journal of Social and Economic Development</em>, 1–20.
</p>

</div>]]></content><author><name>Carlos Delgado</name><email>cadelgado@tamu.edu</email></author><category term="hand-to-mouth households" /><category term="household finance" /><category term="consumption" /><category term="monetary policy" /><category term="fiscal policy" /><category term="behavioral macroeconomics" /><summary type="html"><![CDATA[]]></summary></entry><entry><title type="html">Household Inflation Expectations: From the Brain to the Data</title><link href="https://cadelgadof.github.io/posts/2025/08/household-inflation-expectations-from-brain-to-data/" rel="alternate" type="text/html" title="Household Inflation Expectations: From the Brain to the Data" /><published>2025-08-24T00:00:00+00:00</published><updated>2025-08-24T00:00:00+00:00</updated><id>https://cadelgadof.github.io/posts/2025/08/household-inflation-expectations-from-brain-to-data</id><content type="html" xml:base="https://cadelgadof.github.io/posts/2025/08/household-inflation-expectations-from-brain-to-data/"><![CDATA[<!--more-->

<p>Inflation is defined as the sustained rise in the general price level of the economy. Households may need to predict (even if only superficially) the evolution of prices they will face in order to make convenient budgeting decisions. From an aggregate perspective, obtaining information about households’ inflation expectations is relevant for inferring how they make consumption and investment decisions. Additionally, inflation expectations affect the effectiveness of fiscal and monetary policy and, consequently, realized inflation <a href="https://doi.org/10.1016/B978-0-12-822927-9.00010-1">(D’Acunto et al., 2023)</a>.</p>

<p>In representative agent models, the policy function that determines the optimal path of consumption is given by the Euler equation, which describes the relationship between expected consumption growth and the real interest rate. The latter is defined as the difference between the nominal interest rate and expected inflation. Using this subjective forecast, it is possible to estimate the elasticity of intertemporal substitution, which serves as a calibration input for macroeconomic modeling.</p>

<p>So, how can we obtain data on inflation expectations? A seemingly simple answer would be to ask households directly through surveys. However, this procedure is not trivial, as the design of the questions plays a crucial role.</p>

<p>There are three ways to determine household inflation expectations. The first method is the directional forecast, where households are not asked for a specific rate but only indicate whether they expect inflation in the next period to increase, decrease, or remain the same. The Michigan Survey of Consumers (MSC) uses this type of method. The second method is to ask directly for a specific rate that the individual believes inflation will reach in the next period. This is called a point forecast. Households may initially find it mentally demanding to provide a precise estimate, but <a href="https://www.clevelandfed.org/publications/working-paper/2024/wp-2425-learning-effects-with-household-point-and-density-forecasts-of-inflation">Mitchell et al. (2024)</a> find that inflation forecasts become more accurate as individuals gain practice by completing surveys over subsequent periods.</p>

<p>The third way to elicit inflation expectations is through a density forecast <a href="https://doi.org/10.1111/j.1468-0262.2004.00537.x">(Manski, 2004)</a>, where households report subjective probabilities that future inflation will fall within specific ranges (e.g., between 0% and 2%, between 2% and 4%, etc.). From this information, researchers can compute the mean of the density. To do so, a specific probability function must be assumed. If a household allocates all weight to a single interval, a uniform distribution is applied to calculate the expected inflation. <a href="https://doi.org/10.1198/jbes.2009.0003">Engelberg et al. (2009)</a> propose the following procedure: for example, if all probability mass is assigned to the interval 2%–3%, then the expected inflation is taken as 2.5%. If probabilities are distributed across two intervals, a triangular distribution is used (see Figure 1). In this case, an isosceles triangle is implicitly defined by the lower and upper bounds of the combined intervals, and the mean of the density is located at the peak of the triangle. Moreover, the uniform case with one interval is simply a special case of the triangular distribution, meaning that both approaches yield the same density mean. When probabilities are assigned to three or more intervals, the authors fit a unimodal generalized Beta distribution, with parameters estimated by optimization. Although point and density forecasts are highly correlated, density forecasts provide additional information about inflation uncertainty at the household level <a href="https://doi.org/10.1016/j.jmoneco.2022.01.004">(Crump et al., 2022)</a>; <a href="https://doi.org/10.1257/jep.36.3.157">(Weber et al., 2022)</a>. The Survey of Consumer Expectations (SCE) conducted by the New York Fed includes both point and density forecast questions.</p>

<p><img src="/images/triang-dist.png" alt="Use of a triangular distribution in the case of two adjacent intervals" /></p>

<p><em>Figure 1. Use of a triangular distribution in the case of two adjacent intervals. Source: Engelberg et al. (2009).</em></p>

<p>To ensure accuracy in individual responses, an incentive system can be implemented in which the closer a prediction is to the future realized inflation rate, the higher the monetary payment to the participant. <a href="https://papers.ssrn.com/sol3/papers.cfm?abstract_id=5226305">Drobot et al. (2024)</a> find that, rather than simply increasing participant remuneration, implementing a performance-based marginal incentive is more effective in sharpening empirical inference and improving policy guidance.</p>

<p>One relevant point when eliciting inflation expectations is understanding what households have in mind about the concept of inflation. Surveys generally do not explicitly mention the word inflation when asking for forecasts. Thus, while economists think of inflation in terms of the standard bundle of goods and services, households may instead consider their own bundle. Moreover, given that individuals often display some degree of inattention, they may focus on the most important or frequent purchases made each month to estimate inflation. This raises the question: do households forecast the inflation or their inflation?</p>

<p>In this line, <a href="https://doi.org/10.1016/j.jmoneco.2017.08.002">Kaplan and Schulhofer-Wohl (2017)</a> estimate an annual interquartile range of inflation of 6.2%–9% for U.S. households. They conclude that the heterogeneity of “their” inflations is not explained by variation in consumption bundles but by variation in the prices paid for goods within the same category.</p>

<p>There is also a large dispersion in inflation expectations across households based on demographics. Research has found that low-income, less-educated, and Black households report higher inflation expectations, which is consistent with the fact that they also face higher realized inflation <a href="https://doi.org/10.1257/jep.36.3.157">(Weber et al., 2022)</a>.</p>

<p>With the advancement of more sophisticated methods to survey individuals and elicit their expectations, researchers can obtain the inputs needed to answer new questions in the field. From this perspective, I also believe that in the area of neuroeconomics—which draws on knowledge about brain mechanisms <a href="https://doi.org/10.1257/0022051053737843">(Camerer et al., 2005)</a>—new techniques could be implemented to analyze how individuals perceive and react to inflation in their minds.</p>

<h2 id="references">References</h2>

<div class="blog-references">

<p>
Camerer, C., Loewenstein, G., &amp; Prelec, D. (2005).
<a href="https://doi.org/10.1257/0022051053737843">
Neuroeconomics: How neuroscience can inform economics.
</a>
<em>Journal of Economic Literature, 43</em>(1), 9–64.
</p>

<p>
Crump, R. K., Eusepi, S., Tambalotti, A., &amp; Topa, G. (2022).
<a href="https://doi.org/10.1016/j.jmoneco.2022.01.004">
Subjective intertemporal substitution.
</a>
<em>Journal of Monetary Economics, 126</em>, 118–133.
</p>

<p>
D'Acunto, F., Malmendier, U., &amp; Weber, M. (2023).
<a href="https://doi.org/10.1016/B978-0-12-822927-9.00010-1">
What do the data tell us about inflation expectations?
</a>
In <em>Handbook of Economic Expectations</em> (pp. 133–161). Academic Press.
</p>

<p>
Drobot, S., Puzzello, D., Rholes, R., &amp; Wabitsch, A. (2024).
<a href="https://papers.ssrn.com/sol3/papers.cfm?abstract_id=5226305">
Incentivizing inflation expectations.
</a>
Available at SSRN 5226305.
</p>

<p>
Engelberg, J., Manski, C. F., &amp; Williams, J. (2009).
<a href="https://doi.org/10.1198/jbes.2009.0003">
Comparing the point predictions and subjective probability distributions of professional forecasters.
</a>
<em>Journal of Business &amp; Economic Statistics, 27</em>(1), 30–41.
</p>

<p>
Kaplan, G., &amp; Schulhofer-Wohl, S. (2017).
<a href="https://doi.org/10.1016/j.jmoneco.2017.08.002">
Inflation at the household level.
</a>
<em>Journal of Monetary Economics, 91</em>, 19–38.
</p>

<p>
Manski, C. F. (2004).
<a href="https://doi.org/10.1111/j.1468-0262.2004.00537.x">
Measuring expectations.
</a>
<em>Econometrica, 72</em>(5), 1329–1376.
</p>

<p>
Mitchell, J., Shiroff, T., &amp; Braitsch, H. (2024).
<a href="https://www.clevelandfed.org/publications/working-paper/2024/wp-2425-learning-effects-with-household-point-and-density-forecasts-of-inflation">
Practice Makes Perfect: Learning Effects with Household Point and Density Forecasts of Inflation.
</a>
Federal Reserve Bank of Cleveland, Working Paper No. 24-25.
</p>

<p>
Weber, M., D’Acunto, F., Gorodnichenko, Y., &amp; Coibion, O. (2022).
<a href="https://doi.org/10.1257/jep.36.3.157">
The subjective inflation expectations of households and firms: Measurement, determinants, and implications.
</a>
<em>Journal of Economic Perspectives, 36</em>(3), 157–184.
</p>

<p>
Weber, M., Gorodnichenko, Y., &amp; Coibion, O. (2022).
<a href="https://www.nber.org/papers/w29640">
The expected, perceived, and realized inflation of U.S. households before and during the COVID19 pandemic.
</a>
National Bureau of Economic Research, Working Paper No. 29640.
</p>

</div>]]></content><author><name>Carlos Delgado</name><email>cadelgado@tamu.edu</email></author><category term="inflation expectations" /><category term="household expectations" /><category term="surveys" /><category term="monetary policy" /><category term="neuroeconomics" /><summary type="html"><![CDATA[]]></summary></entry></feed>