
How Do Households Perceive the Evolution of Interest Rates? Some Facts
Published:
The analysis of how consumers perceive and forecast macroeconomic variables is key to better understanding how they make decisions about spending, saving, and borrowing. Existing surveys that elicit household expectations of aggregate variables mainly focus on inflation and unemployment, although the latter is somewhat limited. However, research on how households perceive movements in interest rates remains relatively scarce compared to the extensive work on expectations for other macroeconomic variables.
One reason inflation has been the most common variable used to analyze household expectations is that it is publicly available. Although consumers face different bundles of goods and are exposed to different prices, there is an official measure of inflation. This is not the case for interest rates. While monetary authorities set a nominal policy rate, it serves mainly as a benchmark that guides the evolution of other interest rates in the market.
If we ask households about the expected evolution of interest rates, they are unlikely to think solely about the policy rate; instead, they consider the range of rates they actually face. In addition, there is substantial heterogeneity in households’ financial positions. In this sense, we can distinguish between saving rates and borrowing rates, with the latter being higher on average. At the same time, there are differences depending on the financial product involved. For example, borrowing rates differ between consumer credit and mortgages, with the latter typically associated with collateral. This clearly leads to differences in the magnitudes of interest rates. Additionally, factors such as credit conditions, the type of lending institution, and market power contribute to dispersion in interest rates.
Although institutions construct aggregate measures of interest rates by category, there is no single official variable that represents “the” market interest rate, as there is for inflation. By contrast, institutions define a standard basket of goods and compute a weighted average of prices. However, this is not the case for interest rates, because households differ in their balance sheet positions. Some are more exposed to financial assets, others are more exposed to debt, and some have little or no exposure to these markets.
In this blog, I present some stylized facts about how individuals perceive the evolution of interest rates, including those related to monetary policy. In particular, I focus on cross-sectional differences.
I use data from the Inflation Attitudes Survey (IAS) conducted by the Bank of England, which elicits these perceptions.
Figure 1 presents the year-over-year change in the monetary policy rate in the UK. Three periods are worth highlighting. First, during the years around the Great Recession (2008–2010), there was a sharp expansionary monetary policy, with reductions in the nominal interest rate of more than 4 percentage points. Second, from 2010 to 2017, there was little variation in the policy rate, as the Bank of England had reached the zero lower bound. In this context, central banks implemented unconventional monetary policies such as forward guidance and quantitative easing. Finally, during and after 2020, the policy rate increased to combat the surge in inflation associated with the COVID-19 pandemic, as well as rising commodity prices.
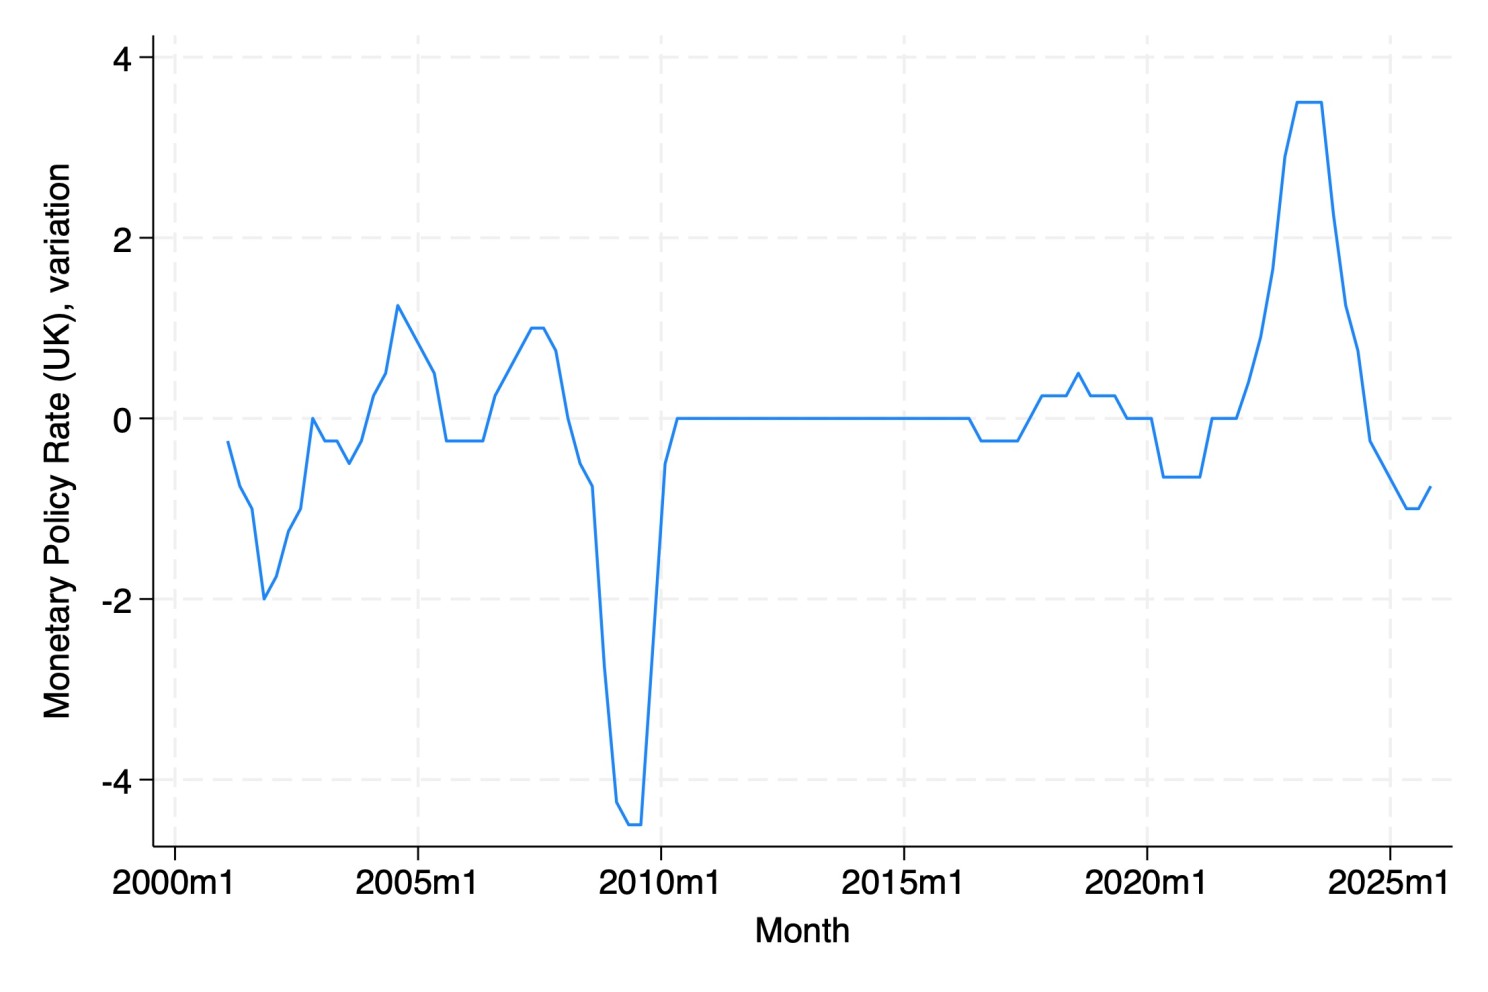
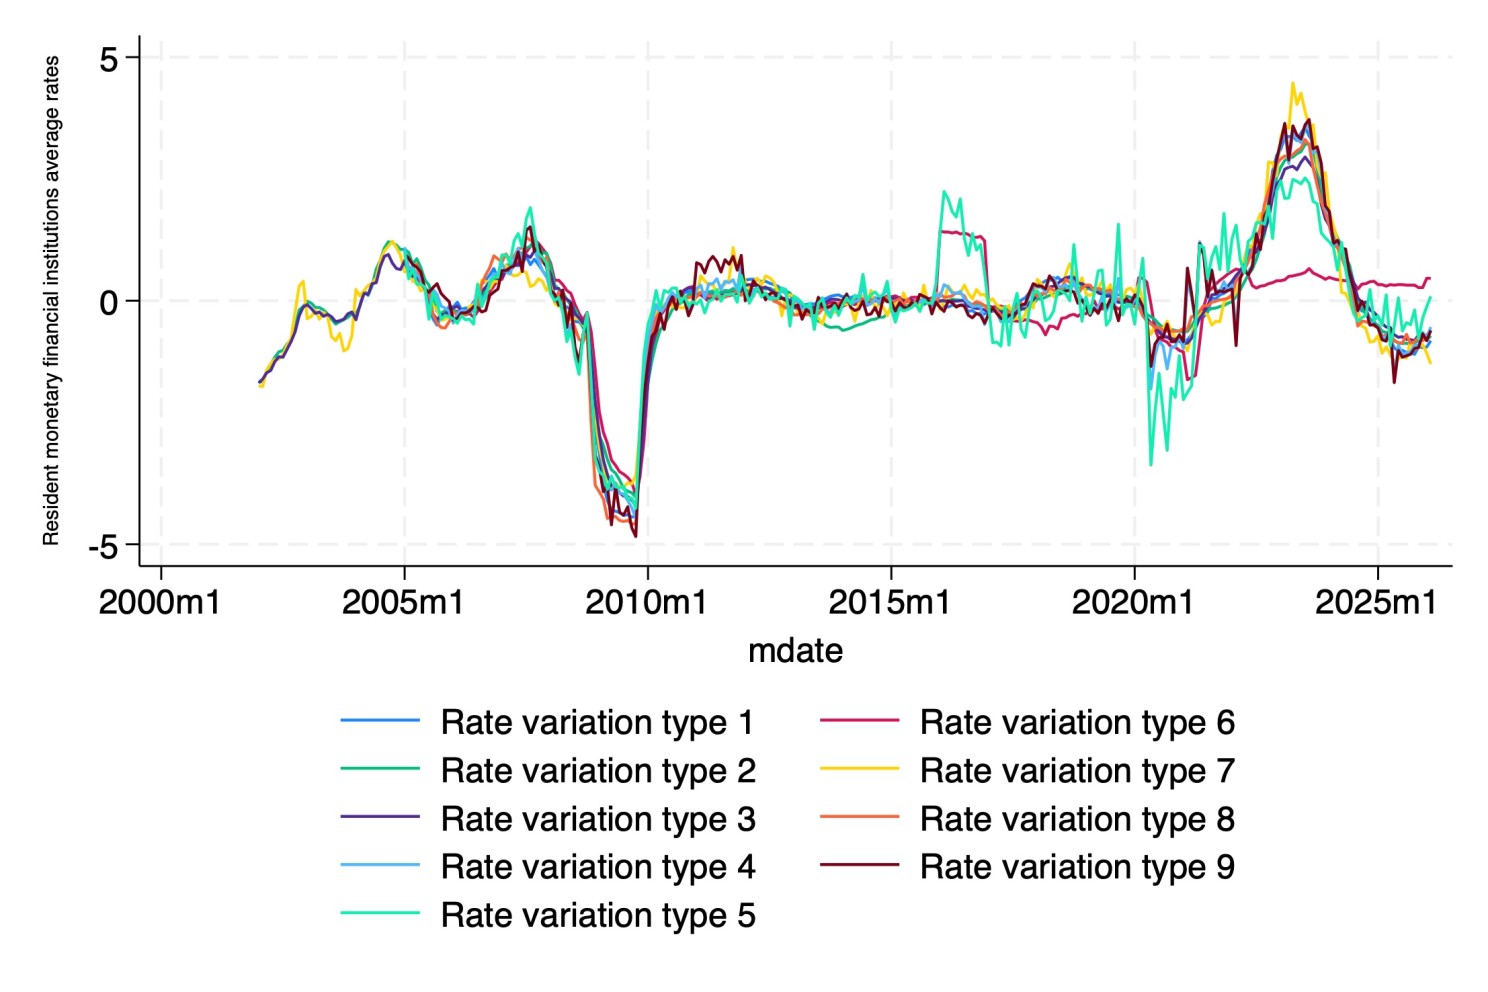
Figure 2 presents the yearly variation in lending interest rates across different categories. I consider the year-over-year variation in the monthly average of sterling-weighted interest rates for UK-resident monetary financial institutions (excluding the central bank) on private non-financial corporations. These rates differ depending on whether they are fixed or floating, as well as on the nature of the transaction (e.g., loans, time deposits, overdrafts, etc.). On average, their evolution follows a similar pattern to the official policy rate.
How do households perceive changes in interest rates across demographic groups? The IAS includes the following question: “How would you say interest rates on things such as mortgages, bank loans, and savings have changed over the last twelve months? Have they…? [Risen a lot, risen a little, stayed about the same, fallen a little, fallen a lot]”
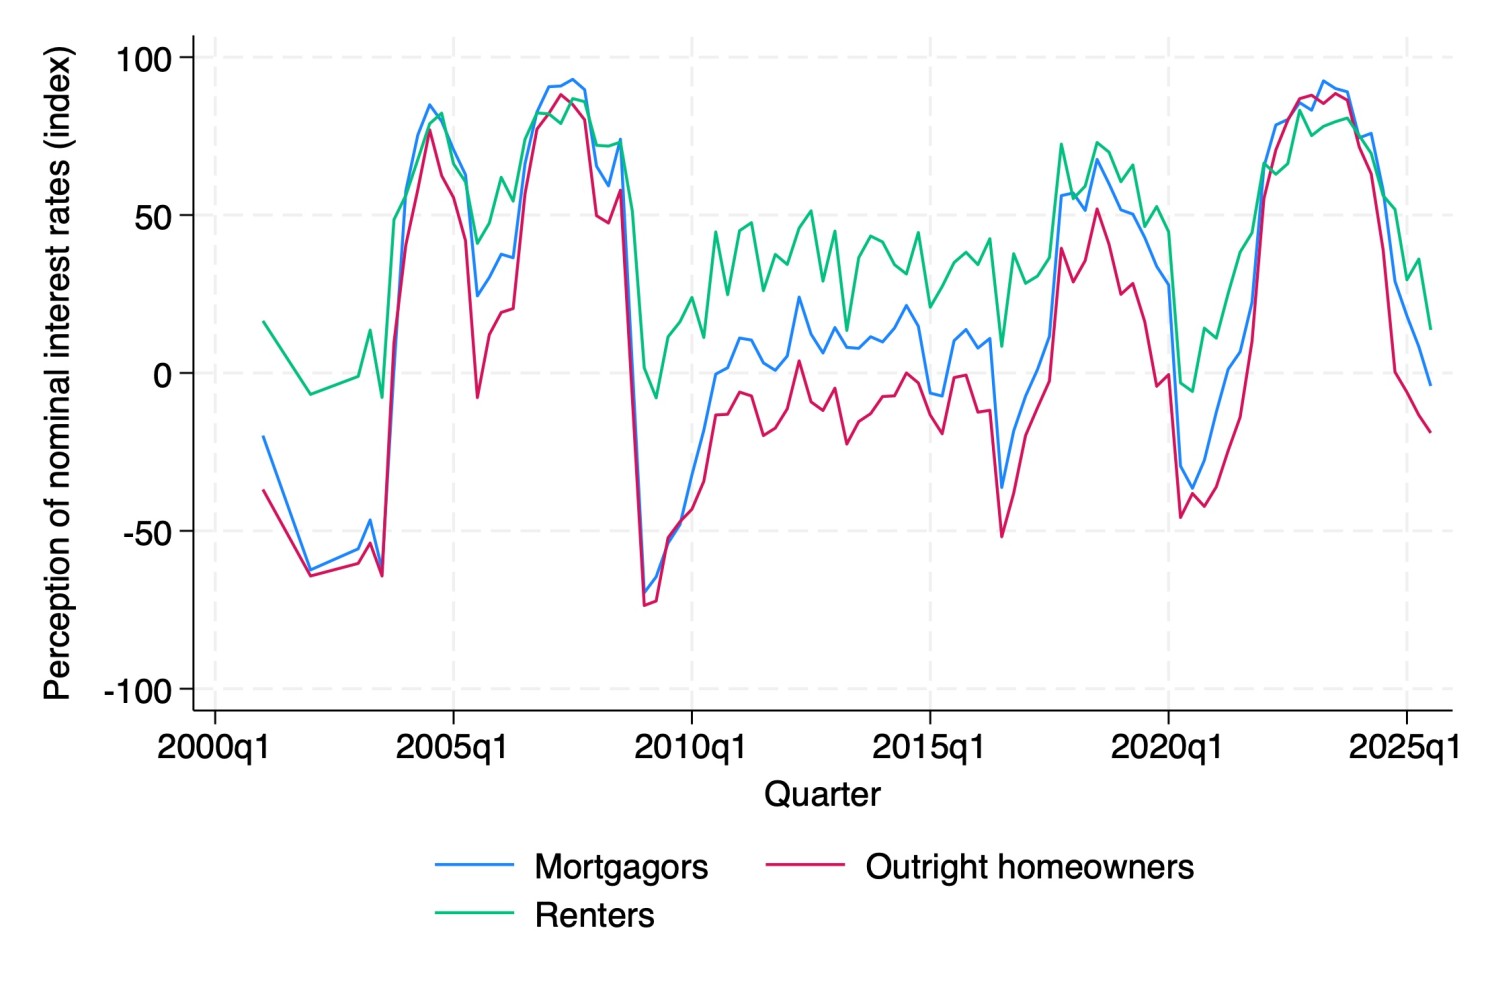
For each period, I construct an index defined as the difference between the share of individuals who answered “risen” and the share who answered “fallen,” using the sample weights provided by the survey. Figure 3 presents the evolution of this index for three groups of households based on their housing tenure status. This characteristic serves as a useful proxy for balance sheet positions (Cloyne et al., 2020). Mortgagors tend to be more exposed to debt, outright homeowners hold relatively more financial assets, and renters are less exposed to both assets and liabilities.
The evidence shows that renters are more likely to perceive that interest rates have increased, whereas outright homeowners are more likely to hold the opposite view. Mortgagors lie in between. During the Great Recession, when interest rates fell sharply, the index for renters declined only slightly and remained close to zero, indicating that many still perceived rates as increasing. Because renters are typically less exposed to financial markets and face tighter liquidity constraints, they tend to be less attentive to interest rate movements. Additionally, since mortgagors are more exposed to debt than outright homeowners (and lending rates are generally higher than saving rates) they are more likely to perceive increases in interest rates compared with homeowners.
I also compared other demographic characteristics, such as gender, education, and income. I did not find differences by gender, but individuals with lower levels of education and income are more likely to perceive an increase in interest rates.
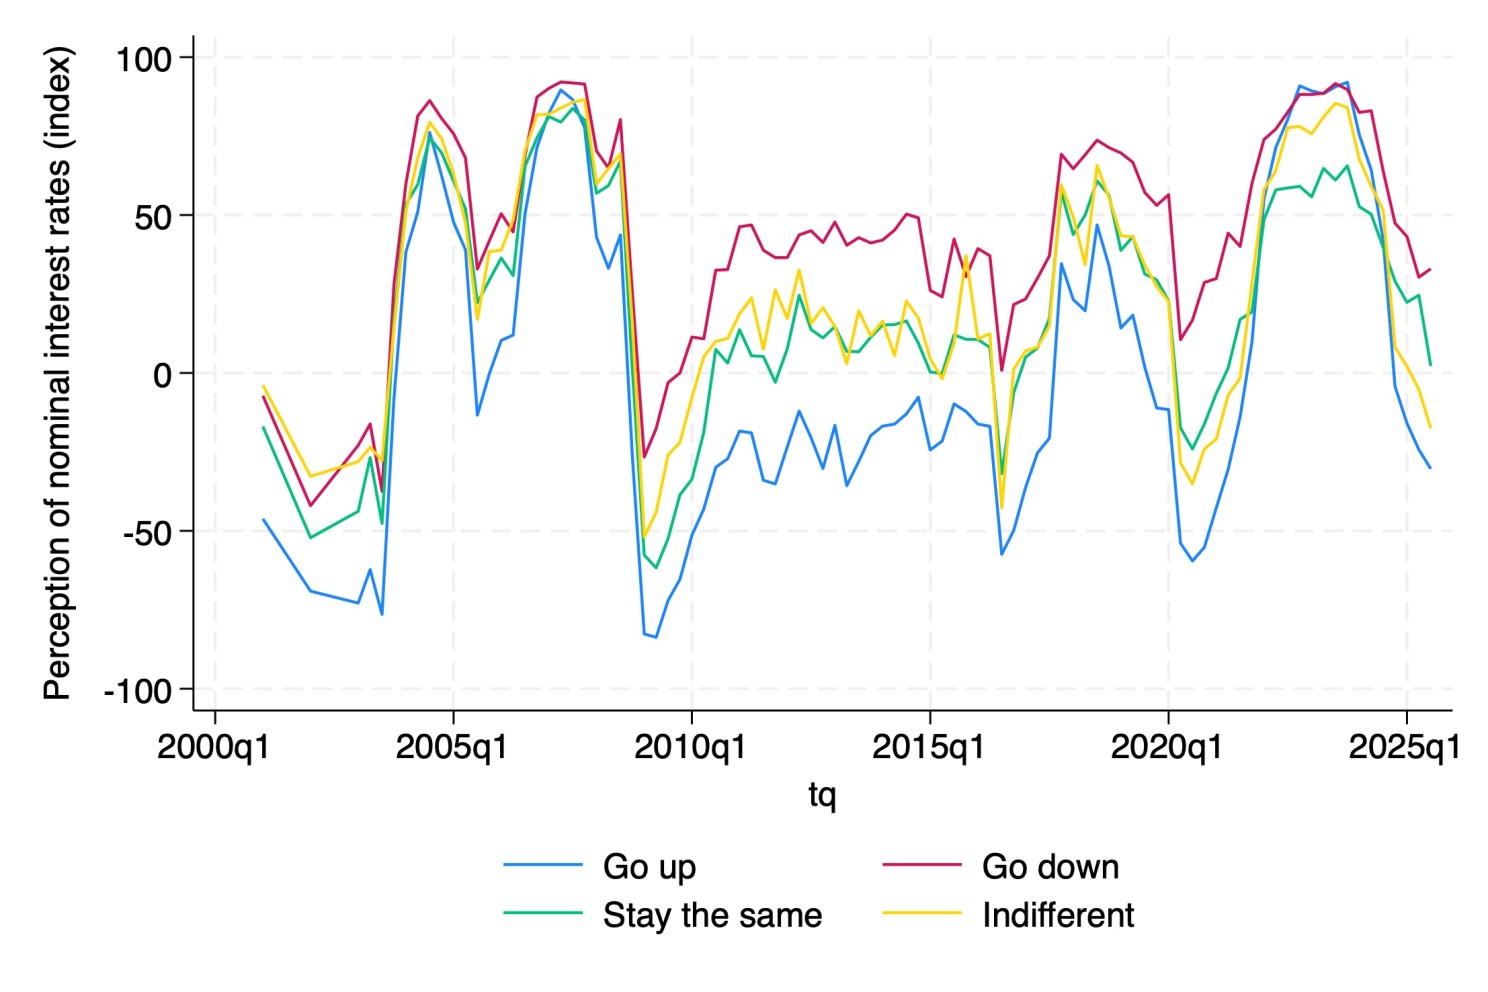
Moreover, personal preferences regarding interest rate movements matter for these perceptions. Figure 4 plots the index for four groups of individuals: (i) those who prefer interest rates to rise, (ii) those who prefer them to fall, (iii) those who prefer rates to remain unchanged, and (iv) those who are indifferent to interest rate changes.
The results are striking: individuals who prefer interest rates to fall are more likely to perceive that rates have increased over the past year. The opposite pattern holds for those who prefer an increase in interest rates. There are no clear differences between individuals who are indifferent and those who prefer stable rates.
A more sophisticated analysis is required to study the causal relationship between preferences and perceptions. One possibility is that perceptions of interest rate movements shape preferences, although these preferences should also be influenced by households’ financial positions (i.e., whether they are net lenders or borrowers). Another possibility is that preferences themselves bias perceptions.
These results shed light on directions for future research. For example, to better understand how the intertemporal substitution channel induced by monetary policy shapes individuals’ decisions between present and future consumption, we need to consider not only how households form expectations about inflation, but also how they perceive nominal interest rates. Since this substitution channel operates through fluctuations in the real interest rate, that is, the difference between the nominal rate and expected inflation, incorporating both elements can provide a clearer picture and help address puzzles in monetary policy transmission.
Additionally, this framework can improve our understanding of the effects of liquidity constraints. Some households (or specific groups) may perceive credit conditions to be worse than they actually are, leading them to self-exclude from financial markets. As a result, monetary policy could have amplified or dampened effects on consumption once these perceptions are taken into account.
References
Cloyne, J., Ferreira, C., & Surico, P. (2020). Monetary policy when households have debt: New evidence on the transmission mechanism. The Review of Economic Studies, 87(1), 102–129.