
Household Inflation Expectations: From the Brain to the Data
Published:
Inflation is defined as the sustained rise in the general price level of the economy. Households may need to predict (even if only superficially) the evolution of prices they will face in order to make convenient budgeting decisions. From an aggregate perspective, obtaining information about households’ inflation expectations is relevant for inferring how they make consumption and investment decisions. Additionally, inflation expectations affect the effectiveness of fiscal and monetary policy and, consequently, realized inflation (D’Acunto et al., 2023).
In representative agent models, the policy function that determines the optimal path of consumption is given by the Euler equation, which describes the relationship between expected consumption growth and the real interest rate. The latter is defined as the difference between the nominal interest rate and expected inflation. Using this subjective forecast, it is possible to estimate the elasticity of intertemporal substitution, which serves as a calibration input for macroeconomic modeling.
So, how can we obtain data on inflation expectations? A seemingly simple answer would be to ask households directly through surveys. However, this procedure is not trivial, as the design of the questions plays a crucial role.
There are three ways to determine household inflation expectations. The first method is the directional forecast, where households are not asked for a specific rate but only indicate whether they expect inflation in the next period to increase, decrease, or remain the same. The Michigan Survey of Consumers (MSC) uses this type of method. The second method is to ask directly for a specific rate that the individual believes inflation will reach in the next period. This is called a point forecast. Households may initially find it mentally demanding to provide a precise estimate, but Mitchell et al. (2024) find that inflation forecasts become more accurate as individuals gain practice by completing surveys over subsequent periods.
The third way to elicit inflation expectations is through a density forecast (Manski, 2004), where households report subjective probabilities that future inflation will fall within specific ranges (e.g., between 0% and 2%, between 2% and 4%, etc.). From this information, researchers can compute the mean of the density. To do so, a specific probability function must be assumed. If a household allocates all weight to a single interval, a uniform distribution is applied to calculate the expected inflation. Engelberg et al. (2009) propose the following procedure: for example, if all probability mass is assigned to the interval 2%–3%, then the expected inflation is taken as 2.5%. If probabilities are distributed across two intervals, a triangular distribution is used (see Figure 1). In this case, an isosceles triangle is implicitly defined by the lower and upper bounds of the combined intervals, and the mean of the density is located at the peak of the triangle. Moreover, the uniform case with one interval is simply a special case of the triangular distribution, meaning that both approaches yield the same density mean. When probabilities are assigned to three or more intervals, the authors fit a unimodal generalized Beta distribution, with parameters estimated by optimization. Although point and density forecasts are highly correlated, density forecasts provide additional information about inflation uncertainty at the household level (Crump et al., 2022); (Weber et al., 2022). The Survey of Consumer Expectations (SCE) conducted by the New York Fed includes both point and density forecast questions.
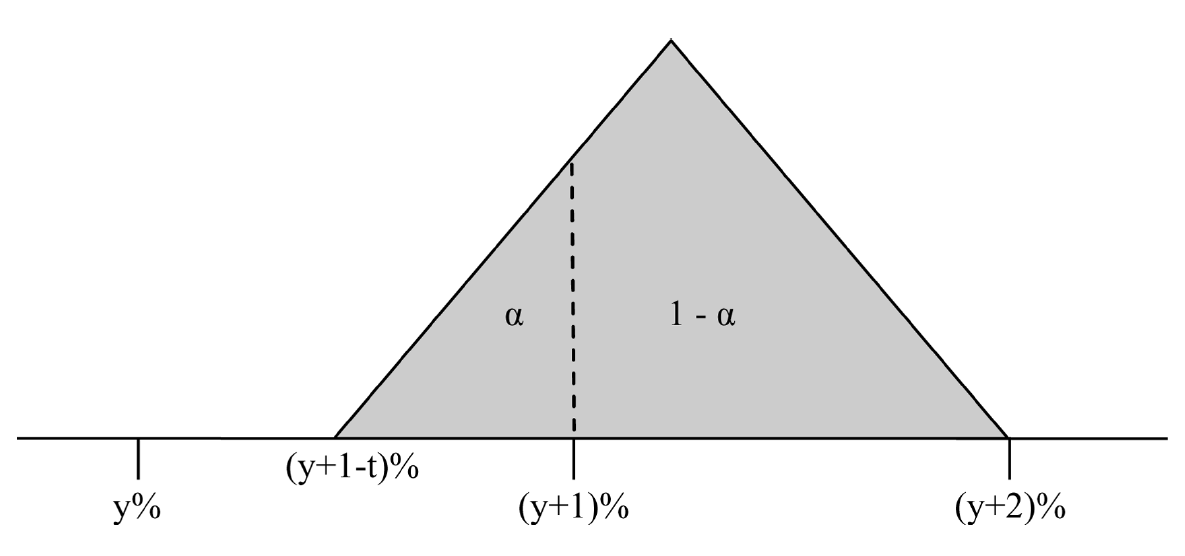
Figure 1. Use of a triangular distribution in the case of two adjacent intervals. Source: Engelberg et al. (2009).
To ensure accuracy in individual responses, an incentive system can be implemented in which the closer a prediction is to the future realized inflation rate, the higher the monetary payment to the participant. Drobot et al. (2024) find that, rather than simply increasing participant remuneration, implementing a performance-based marginal incentive is more effective in sharpening empirical inference and improving policy guidance.
One relevant point when eliciting inflation expectations is understanding what households have in mind about the concept of inflation. Surveys generally do not explicitly mention the word inflation when asking for forecasts. Thus, while economists think of inflation in terms of the standard bundle of goods and services, households may instead consider their own bundle. Moreover, given that individuals often display some degree of inattention, they may focus on the most important or frequent purchases made each month to estimate inflation. This raises the question: do households forecast the inflation or their inflation?
In this line, Kaplan and Schulhofer-Wohl (2017) estimate an annual interquartile range of inflation of 6.2%–9% for U.S. households. They conclude that the heterogeneity of “their” inflations is not explained by variation in consumption bundles but by variation in the prices paid for goods within the same category.
There is also a large dispersion in inflation expectations across households based on demographics. Research has found that low-income, less-educated, and Black households report higher inflation expectations, which is consistent with the fact that they also face higher realized inflation (Weber et al., 2022).
With the advancement of more sophisticated methods to survey individuals and elicit their expectations, researchers can obtain the inputs needed to answer new questions in the field. From this perspective, I also believe that in the area of neuroeconomics—which draws on knowledge about brain mechanisms (Camerer et al., 2005)—new techniques could be implemented to analyze how individuals perceive and react to inflation in their minds.
References
Camerer, C., Loewenstein, G., & Prelec, D. (2005). Neuroeconomics: How neuroscience can inform economics. Journal of Economic Literature, 43(1), 9–64.
Crump, R. K., Eusepi, S., Tambalotti, A., & Topa, G. (2022). Subjective intertemporal substitution. Journal of Monetary Economics, 126, 118–133.
D'Acunto, F., Malmendier, U., & Weber, M. (2023). What do the data tell us about inflation expectations? In Handbook of Economic Expectations (pp. 133–161). Academic Press.
Drobot, S., Puzzello, D., Rholes, R., & Wabitsch, A. (2024). Incentivizing inflation expectations. Available at SSRN 5226305.
Engelberg, J., Manski, C. F., & Williams, J. (2009). Comparing the point predictions and subjective probability distributions of professional forecasters. Journal of Business & Economic Statistics, 27(1), 30–41.
Kaplan, G., & Schulhofer-Wohl, S. (2017). Inflation at the household level. Journal of Monetary Economics, 91, 19–38.
Manski, C. F. (2004). Measuring expectations. Econometrica, 72(5), 1329–1376.
Mitchell, J., Shiroff, T., & Braitsch, H. (2024). Practice Makes Perfect: Learning Effects with Household Point and Density Forecasts of Inflation. Federal Reserve Bank of Cleveland, Working Paper No. 24-25.
Weber, M., D’Acunto, F., Gorodnichenko, Y., & Coibion, O. (2022). The subjective inflation expectations of households and firms: Measurement, determinants, and implications. Journal of Economic Perspectives, 36(3), 157–184.
Weber, M., Gorodnichenko, Y., & Coibion, O. (2022). The expected, perceived, and realized inflation of U.S. households before and during the COVID19 pandemic. National Bureau of Economic Research, Working Paper No. 29640.